

Stratified sampling is a method of sampling that divides a population into distinct subgroups before selecting a random sample from each one. It’s helpful in market research when an audience isn’t uniform but composed of meaningful segments, such as age groups, regions, income levels or customer types.
Those differences matter. Rather than drawing one random sample and hoping every key group is represented, stratified sampling ensures each segment is included. This reduces sampling error and produces more dependable results.
In this guide, we’ll explain what stratified sampling is and when it works best. We’ll also walk through how to apply it step by step and where it can fall short, so you can choose the right approach for your research.
TL;DR
- Stratified sampling is a probability sampling method that divides a population into non-overlapping subgroups (strata) based on shared characteristics (like age, gender or income).
- It’s most useful when your audience has meaningful segments and you need to compare groups with confidence.
- It reduces sampling error and improves precision, so smaller groups don’t get missed. This helps businesses make more informed decisions.
- Strata must be mutually exclusive and collectively exhaustive (i.e. each person fits into one group).
- You can allocate sample sizes proportionately (mirror the population) or disproportionately (oversample small groups for reliable comparisons).
- The trade-off: it requires good population info and clean definitions, and it gets harder to run if you have a lot of strata.
What is stratified sampling?
Stratified sampling is a way of building a survey sample that reflects the real structure of your audience.
Instead of treating a population as one large group, this method starts by splitting it into smaller, clearly defined subgroups called strata. These might be based on age, region, income, education level or customer type. A random sample is then taken from each stratum, rather than from the population as a whole.
The key idea is simple: when different groups are likely to think or behave differently, you want to make sure each one is properly represented. Every respondent belongs to one, and only one, stratum, and each group is sampled independently.
By reducing variation within each subgroup, stratified sampling lowers sampling error and improves precision. The result is data that more closely mirrors your population and insights you can trust when comparing segments or making decisions that affect specific groups.
Why use stratified sampling? (The business value)
Stratified sampling has tangible business impact because it improves decision-making by increasing the accuracy and reliability of survey results.
Also, sampling within defined subgroups reduces sampling error (when your sample does not accurately represent the target population) and ensures smaller but important groups are not overlooked.
Because each segment is intentionally represented, comparisons are more precise. This leads to better-targeted insights and stronger ROI, without relying on larger samples or more complex analysis than necessary.
When to use stratified sampling
So, if the value of stratified sampling makes sense, the question becomes when to use it. Choosing the right sampling method depends on how your audience is structured and what you’re trying to measure
Stratified sampling is most useful when treating everyone as one homogenous group would blur important differences or introduce unnecessary risk into your results.
Here’s when to use the stratified sampling method:
- When the population is heterogeneous. If your audience includes distinct subgroups with significant differences—such as age groups, gender identities, education levels or regions—the simple random sampling method can underrepresent some of them by chance alone.
- When subgroup outcomes are expected to differ. If behavior, attitudes or outcomes are likely to vary by group, stratified sampling makes those differences visible. For example, product usage may change by region, or health outcomes may vary by age. Sampling within each subgroup helps capture those patterns more accurately.
- To prevent under or overrepresentation. Smaller groups won’t be missed, and larger groups won’t dominate the results simply because they make up more of the population.
- To reduce sampling error and improve precision. By lowering variability within each stratum, stratified sampling produces more stable estimates than simple random sampling.
- To enable reliable subgroup comparisons. By structuring the sample up front, stratified sampling enables more confident comparisons across age, income, region, or education level.
How stratified sampling works (step-by-step)
Stratified sampling follows a structured process. While it requires more upfront planning than simple random sampling, each step is designed to improve accuracy and make sure your final sample reflects the real makeup of your population.
Here’s how to run stratified sampling from start to finish.
Step 1: Define the population
The process starts by clearly defining the population you want to study. This might be:
- Your current customers
- Adults in a specific country
- Recent graduates
- Users of a particular product.
At this stage, keep one rule in mind: Every individual in the population must be able to fit into one subgroup later on. The way you define population must support that.
You can use characteristics like age brackets, gender identity, education level, region or customer type to prepare for stratification. Whatever you choose, the criteria must be unambiguous. If respondents could reasonably fall into more than one group, accuracy will suffer further down the line.
Step 2: Identify meaningful strata
Once the population is defined, the next step is to divide it into strata. These are the subgroups you’ll sample from independently.
Researchers must assign each person in the population to only one stratum. The strata should be internally similar but, taken together, cover the entire population. This ensures the groups are mutually exclusive and collectively exhaustive.
You can stratify using a single characteristic or multiple characteristics at once, as long as every individual can still be placed into a single subgroup. When stratifying by multiple characteristics, the total number of strata is calculated by multiplying the number of groups within each characteristic.
For example, say your population is university graduates from the last ten years, and you stratify by gender identity and degree level:
| Characteristic | Strata | Groups |
| Gender identity | Female, male, other | Female bachelor’s graduates Male bachelor’s graduates Other bachelor’s graduates Female master’s graduates Male master’s graduates Other master’s graduates Female doctoral graduates Male doctoral graduates Other doctoral graduates |
| Highest degree level obtained | Bachelor’s, master’s, doctorate |
In this case, three gender groups multiplied by three degree levels result in nine distinct strata. Each graduate must be placed into exactly one of these groups.
Step 3: Decide sample size for each stratum
Once your strata are defined, the next step is deciding how many respondents to include from each group. This usually means choosing between proportionate and disproportionate allocation.
- Proportionate sampling: Each stratum’s sample size matches its share of the total population. For example, if a group makes up 20% of the population, it will make up roughly 20% of the sample. This works well when all subgroups are large enough to analyze reliably.
- Disproportionate sampling: Smaller or underrepresented groups are intentionally oversampled. This approach is useful when certain strata are critical to the research but would otherwise produce too few responses for meaningful analysis.
For example, doctoral graduates may represent only a small part of the population. Using proportionate sampling could leave you with too little data to draw conclusions. A disproportionate approach might balance the sample evenly across bachelor’s, master’s and doctoral graduates to support reliable comparisons.
You’ll also need to decide on your total sample size. This depends on your margin of error, confidence level and how precise your subgroup analysis needs to be. A sample size calculator can help estimate the right numbers.
(Temporally Unavailable)
Step 4: Randomly sample within each stratum
With sample sizes set, researchers select participants randomly within each stratum using methods like simple random sampling (everyone in the stratum has an equal chance of being selected) or systematic sampling (you select every nth person from a random starting point). Randomization happens inside each subgroup, not across the full population.
This helps prevent bias and keeps selection consistent within each stratum.
Step 5: Combine the samples
The final step is to merge the randomly selected participants from each stratum into one overall sample. Because each subgroup was sampled independently, the combined sample mirrors the population structure and supports accurate conclusions.
The pros and cons of stratified sampling
Stratified sampling can be a powerful way to improve accuracy and confidence in survey results, but it isn’t the right choice for every study. Like all probability-based approaches, it comes with trade-offs that depend on how well you understand your target population and how the strata are defined.
Below is a balanced look at where stratified sampling works well and where it can introduce complexity.
Advantages
- Produces a representative sample: By design, stratified sampling ensures key subgroups are accounted for in the sample design, making it easier to conclude about the entire population rather than relying on chance coverage.
- Enables more precise estimates: Grouping similar respondents together reduces variability within each stratum, leading to more accurate estimates and, in many cases, estimates that are more precise than those from other sampling methods.
- Supports reliable subgroup comparisons: Because each segment is sampled intentionally, researchers can compare age groups, regions or income levels with greater confidence than with simple random sampling.
- Improves efficiency with proportional allocation: Approaches like proportional stratified random sampling mirror the structure of the target population which helps teams achieve strong results without unnecessarily inflating sample size.
- Minimizes bias for diverse populations: When a population has too many differences to treat as uniform, stratification helps avoid overrepresenting dominant groups or missing smaller ones entirely.
Limitations
- Requires detailed population knowledge: Stratified sampling only works when researchers understand the structure of the entire population and can accurately classify every respondent.
- Strata must be clearly defined: If groups overlap or are ambiguous, individuals may be misclassified, leading to biased results and unreliable estimates.
- Can become complex to manage: As the number of strata grows, setup and data collection become more time-consuming and resource-intensive compared to simpler approaches.
- Risk of over-segmentation: Creating too many strata can result in very small subgroup sizes, reducing statistical reliability rather than improving it.
- Not always better than other sampling methods: For homogeneous groups or exploratory studies, simpler approaches may deliver similar value with less effort.
Stratified sampling example
To put all of the above into context, Here’s an example:
Say you’re running a customer satisfaction study for a national retail brand. Your target population includes customers from three regions: Northeast, Midwest and West.
Past research suggests that shopping behavior and satisfaction scores differ by region, so treating the audience as one uniform group could hide those differences. So, instead of using simple random sampling, you stratify the population by region.
If 50% of your customers are in the Northeast, 30% in the Midwest and 20% in the West, you can apply proportional stratified sampling so your final sample reflects the same split. If your total sample size is 400, that means randomly selecting 200 respondents from the Northeast, 120 from the Midwest and 80 from the West.
Because each region is sampled independently, smaller regions aren’t missed and larger regions don’t dominate the results. This makes it easier to compare satisfaction levels across regions and understand where experiences differ.
On the Attest platform, stratified sampling is handled through demographic quotas. When setting up your audience, you can apply demographic filters such as age, gender, region or income, then assign quotas to control how many respondents from each group can complete the survey.
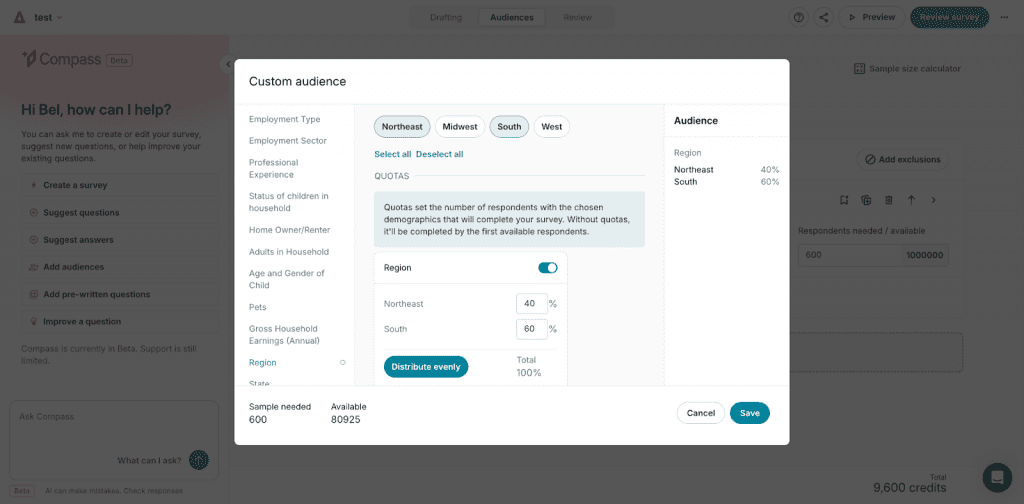
You can set exact percentages or let the platform distribute responses evenly. This makes it easier to maintain a representative sample, reduce manual setup errors and ensure key groups are included from the start.
Stratified sampling is worth the extra step
Stratified sampling helps you move beyond averages and understand how different groups within your audience actually behave. By dividing a population into meaningful subgroups and sampling within each one, you reduce sampling error and improve precision. The result is data you can trust and insights that support confident decision making.
That said, stratification isn’t always the right fit. When speed or simplicity matters more, or when subgroup analysis isn’t essential, quota sampling can be a practical alternative. Learn when it makes sense to use quota sampling instead and how it compares to stratified approaches.
A stratified sample is when you split your audience into clear groups, then randomly sample within each one. For example, a retailer divides customers by region (North, Central, South) and randomly surveys 100 people from each region. Each region is intentionally represented, so results reflect the full customer base.
Simple random sampling selects respondents from the whole population at once, so every person has an equal chance of being chosen. Stratified sampling first divides the population into subgroups (strata) and then randomly samples within each subgroup. This helps ensure key segments are included and supports clearer group comparisons.
Stratified sampling improves the reliability of survey results by ensuring important subgroups are represented. It reduces sampling error, increases precision, and makes it easier to compare segments like regions, age groups, or customer types. It can also support better insight from smaller groups without needing a much larger total sample.