

Ask most brands to describe how a 58-year-old spends their evening and you’ll probably get some version of “the TV’s on and that’s about it.” The real picture has more going on: the evening news is on live TV, yes, but there was also a radio playing on the drive home, a Facebook thread with family somewhere in between, and a paperback waiting by the bed.
It’s a rhythm built around fewer, steadier habits rather than a dozen competing apps, but it’s no less rich a picture for a brand trying to understand where this audience’s time and attention actually go.
Drawing on Attest’s 2026 US and UK media consumption research, this piece maps the daily media diet of over-50s medium by medium: how much time they give each one, how many of them engage with it at all, and how much attention they’re really paying once they do.
TL:DR
- Live TV and streaming services still anchor the daily routine, and over-50s give the TV their full, undivided attention more often than any younger generation tested.
- Facebook, not TikTok or Instagram, is by far the platform over-50s feel most hooked on, in both the US and UK.
- Radio holds up far better with this age group than with younger ones, reaching around 7 in 10 over-50s in both markets.
- AI-generated ads are a much smaller turn-off for over-50s than for Gen Z, most disengagement here comes down to plain ad fatigue, too many ads, too repetitive, too long.
- Podcasts and audiobooks reach a smaller share of over-50s than younger generations, but news sites and physical newspapers hold up strongly, especially in the UK.
- Nearly all over-50s use at least one platform on an ad-supported tier, and the large majority skip ads whenever they’re given the choice.
- Over 50s’ media consumption pattern is smaller and steadier than Gen Z’s media diet, but far from a disengaged.
A typical day in over-50s’ media diet
| Activity | US: time / reach | UK: time / reach |
|---|---|---|
| Live TV | 2h 25m / 77% | 1h 57m / 82% |
| Streaming service | 2h 19m / 70% | 1h 37m / 79% |
| YouTube | 1h 25m / 83% | 56m / 80% |
| TikTok | 1h 17m / 48% | 52m / 36% |
| Facebook/Instagram video | 1h 09m / 81% | 48m / 76% |
| News sites/apps | 37m / 62% | 31m / 83% |
| Physical newspaper | 36m / 21% | 28m / 34% |
| Digital book | 1h 03m / 21% | 44m / 24% |
| Physical book | 55m / 46% | 46m / 60% |
| Radio | 1h 10m / 69% | 1h 23m / 79% |
| Music streaming | 1h 08m / 53% | 56m / 59% |
| Podcast | 54m / 36% | 41m / 49% |
| Audiobook | 1h 12m / 16% | 38m / 18% |
Time shown is the average among people who actually use each format, not the whole population, reach shows what share of over-50s that is.

Streamed TV
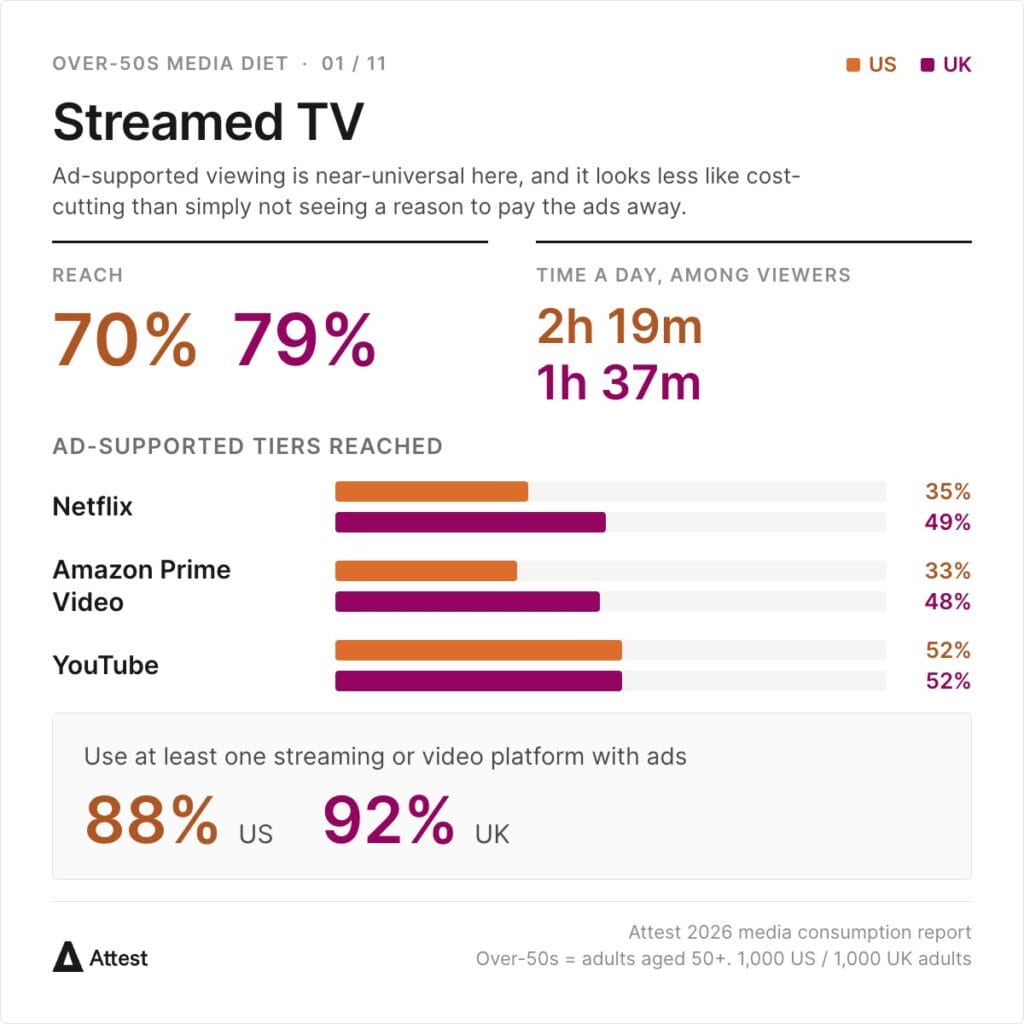
Streaming services reach 70% of over-50s in the US and 79% in the UK, and among those who use them, viewing runs long, 2 hours 19 minutes a day in the US and 1 hour 37 minutes in the UK.
Most of that viewing happens on an ad-supported plan: 88% of US over-50s and 92% of UK over-50s use at least one streaming or video platform with ads, with Netflix’s ad tier reaching 35% in the US and 49% in the UK, and Amazon Prime Video’s reaching 33% and 48% respectively.
Unlike Gen Z, where ad-supported viewing is often a matter of avoiding a subscription cost, ad-tier use at this age looks more like simply not seeing much reason to pay extra to remove the ads.
Live TV
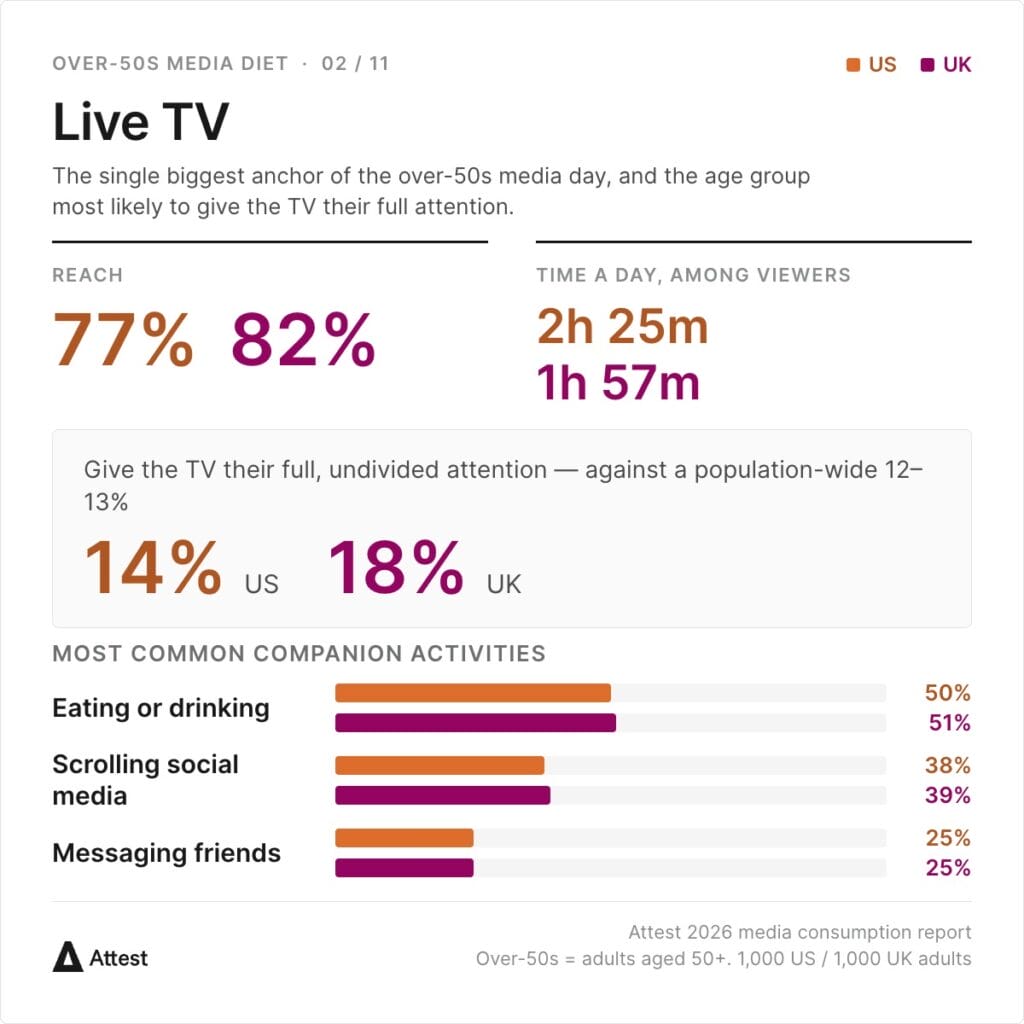
Live TV remains the single biggest anchor of the over-50s media day, reaching 77% in the US and 82% in the UK, with those who watch it doing so for 2 hours 25 minutes and 1 hour 57 minutes respectively.
Over 50s are more likely than other generations to give TV their full, undivided attention: 14% of US over-50s and 18% of UK. That said, most over-50s are still doing something else at the same time. The single biggest companion activity by far is eating or drinking (50% US, 51% UK), followed by scrolling social media (38% US, 39% UK) and messaging friends (25% both markets). Second-screening is the norm here too, just a somewhat less constant one than among younger viewers.
Social video
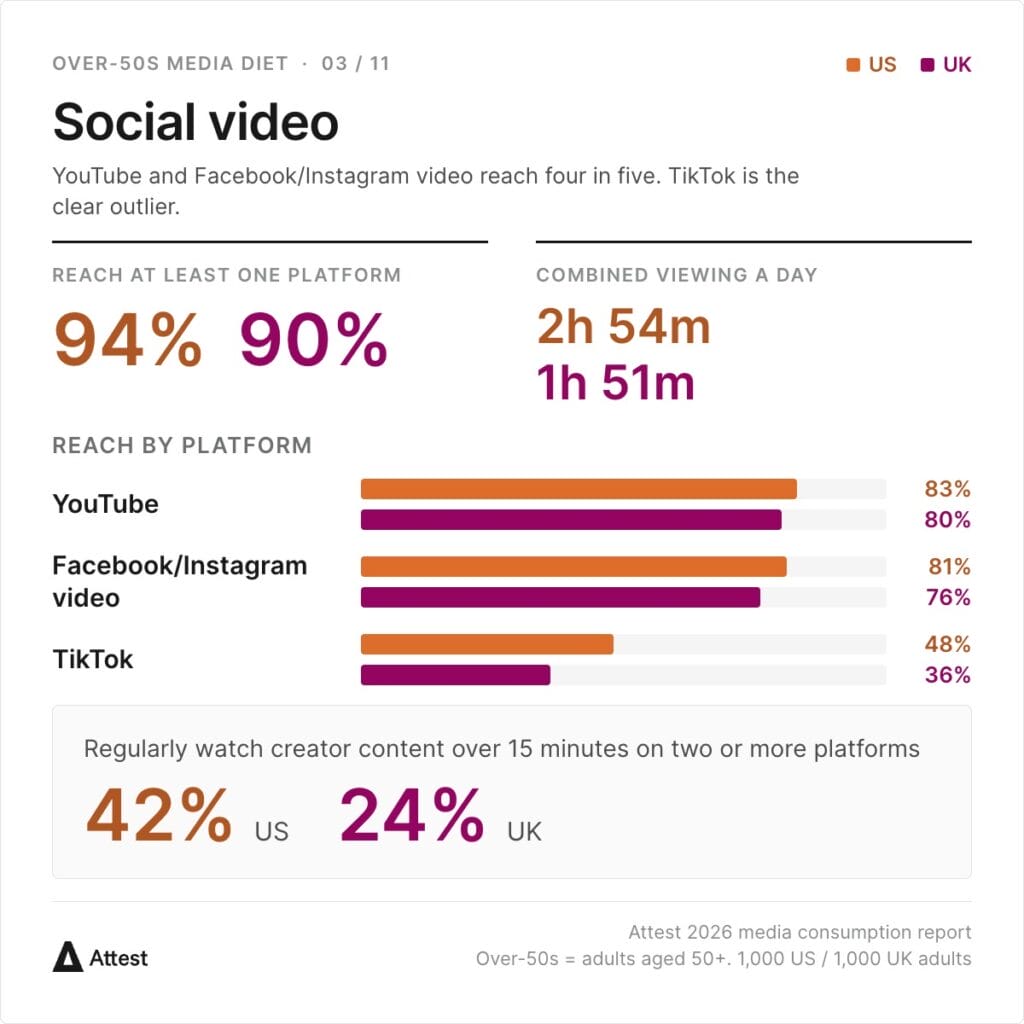
Taken together, social video reaches the large majority of over-50s: 94% in the US and 90% in the UK use at least one of YouTube, TikTok or Facebook/Instagram video, and among that group, combined viewing runs to 2 hours 54 minutes a day in the US and 1 hour 51 minutes in the UK.
YouTube is comfortably the biggest single platform, reaching 83% in the US (1h 25m among viewers) and 80% in the UK (56m among viewers), and its ad-supported tier reaches roughly half of over-50s in both markets (52%). TikTok is the clear outlier, reaching under half of this age group (48% US, 36% UK), with much shorter engaged viewing time (1h 17m US, 52m UK) than YouTube or Facebook/Instagram.
Long-form, creator-made content over 15 minutes is a regular habit on two or more platforms for 42% of US over-50s, but only 24% of their UK counterparts, one of the larger gaps between the two markets in this report.
Social media
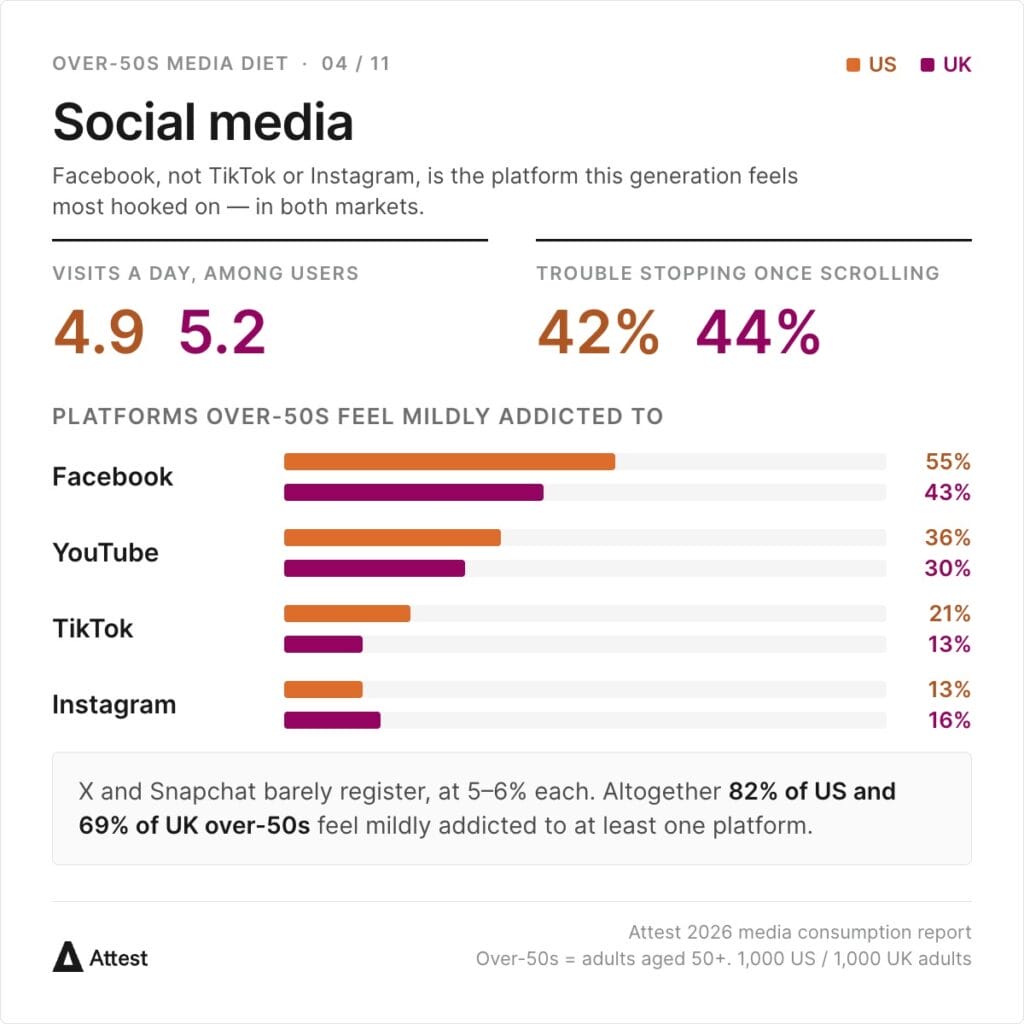
Over-50s visit social media around 5 times a day on average among those who use it (4.9 in the US, 5.2 in the UK), a noticeably lighter rhythm than the 7-8 daily visits typical of Gen Z.
Once scrolling, though, plenty still find it hard to stop: 42% in the US and 44% in the UK say they have trouble putting a social feed down once they start, not far off the population-wide average. Facebook is, by a wide margin, the platform this generation feels most hooked on, 55% of US over-50s and 43% of UK over-50s describe themselves as mildly addicted to it, roughly double the next-placed platform, YouTube (36% US, 30% UK).
TikTok (21% US, 13% UK) and Instagram (13% US, 16% UK) trail well behind, and X and Snapchat barely register (5-6% each). Altogether, 82% of US over-50s and 69% of UK over-50s say they feel mildly addicted to at least one platform, lower than younger generations, but still a majority in both markets.
Music streaming
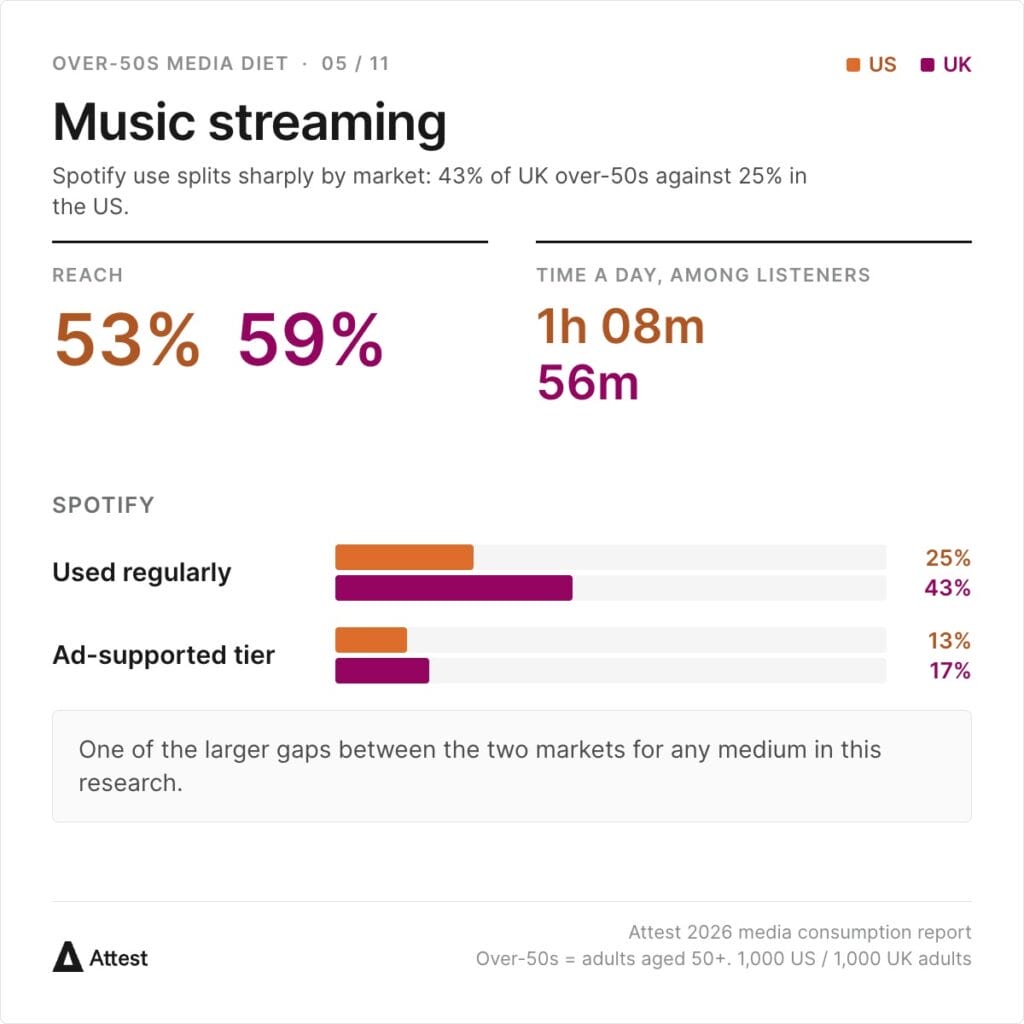
Music streaming reaches 53% of US over-50s and 59% of UK over-50s, with engaged listeners putting in 1 hour 8 minutes and 56 minutes a day respectively.
Spotify specifically is used regularly by around a quarter of US over-50s (25%) and 43% of UK over-50s, one of the larger gaps between the two markets for any medium in this report, and its ad-supported tier reaches 13% in the US and 17% in the UK.
Radio
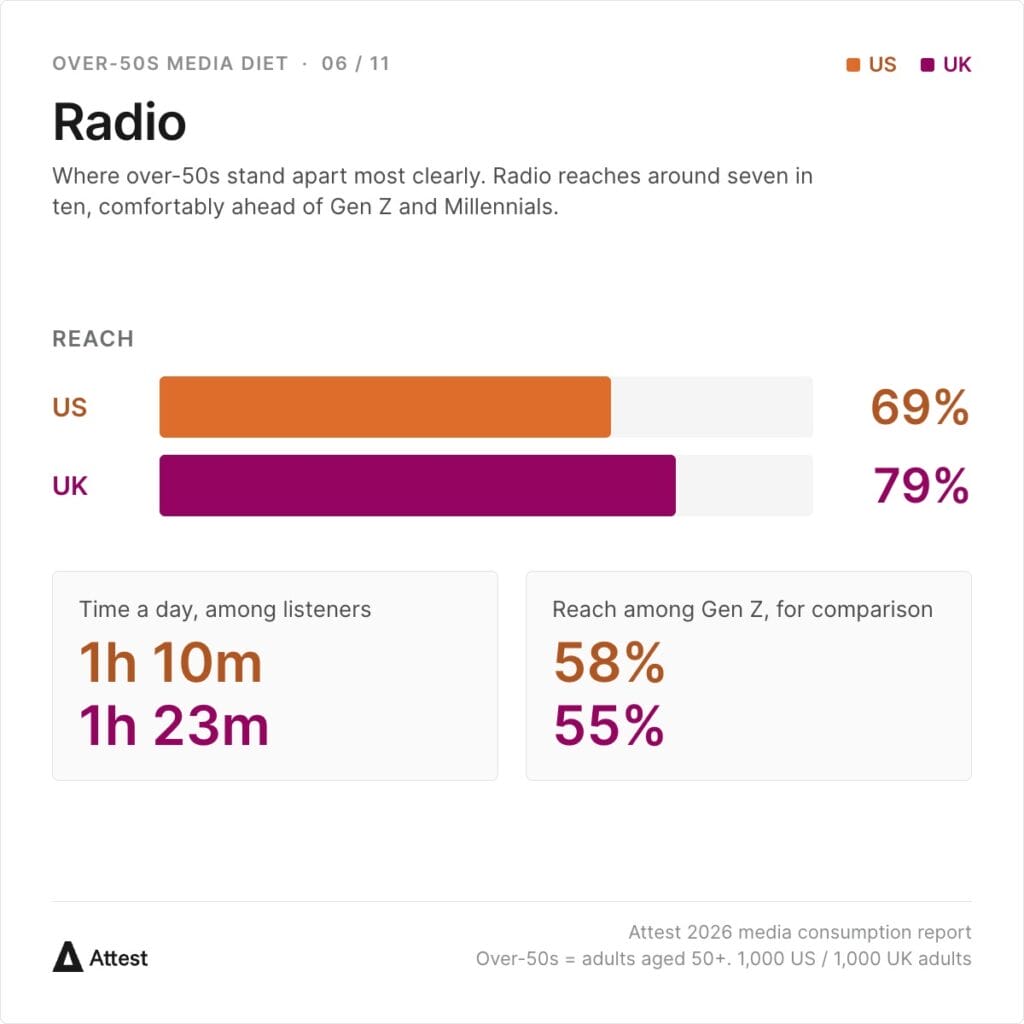
Radio is where over-50s stand apart most clearly from younger generations: it reaches 69% in the US and 79% in the UK, among the highest reach figures of any medium tested for this age group, and comfortably ahead of the reach seen among Gen Z or Millennials.
Among those who tune in, listening runs to 1 hour 10 minutes in the US and 1 hour 23 minutes in the UK, a habit that has clearly held its ground even as younger audiences have moved elsewhere for audio.
Podcasts
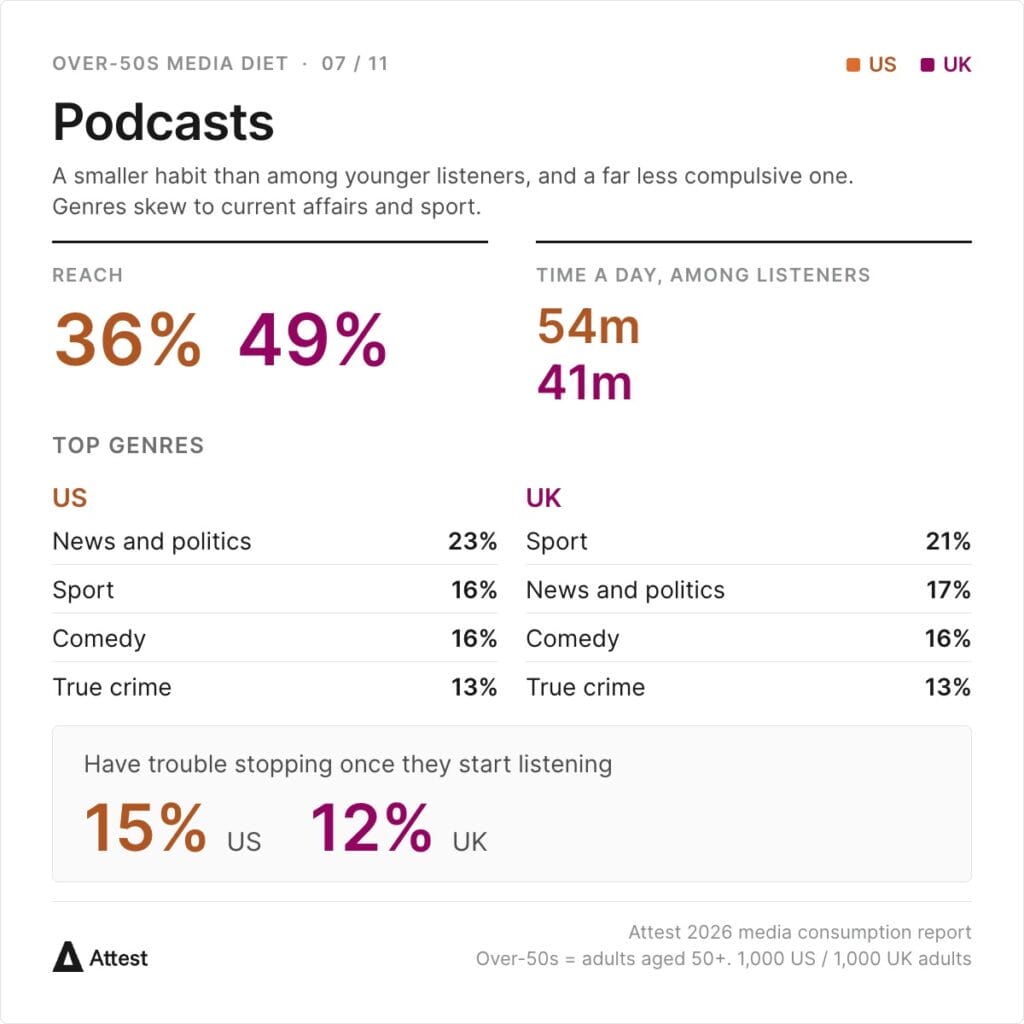
Podcasts reach a smaller share of over-50s than younger generations, 36% in the US and 49% in the UK, though among those who do listen, sessions run a healthy 54 minutes in the US and 41 minutes in the UK. It’s also a notably less compulsive habit for this age group: only 15% of US over-50s and 12% of UK over-50s say they have trouble stopping once they start listening, among the lowest stickiness figures in this report.
Genre preferences skew toward current affairs and lighter fare over true crime: news and politics is the top genre in the US (23%), with sport (16%) and comedy (16%) close behind; in the UK, sport leads (21%), followed by news and politics (17%) and comedy (16%). True crime, a top genre for younger listeners, ranks a more modest fourth in both markets (13%).
Books and audiobooks
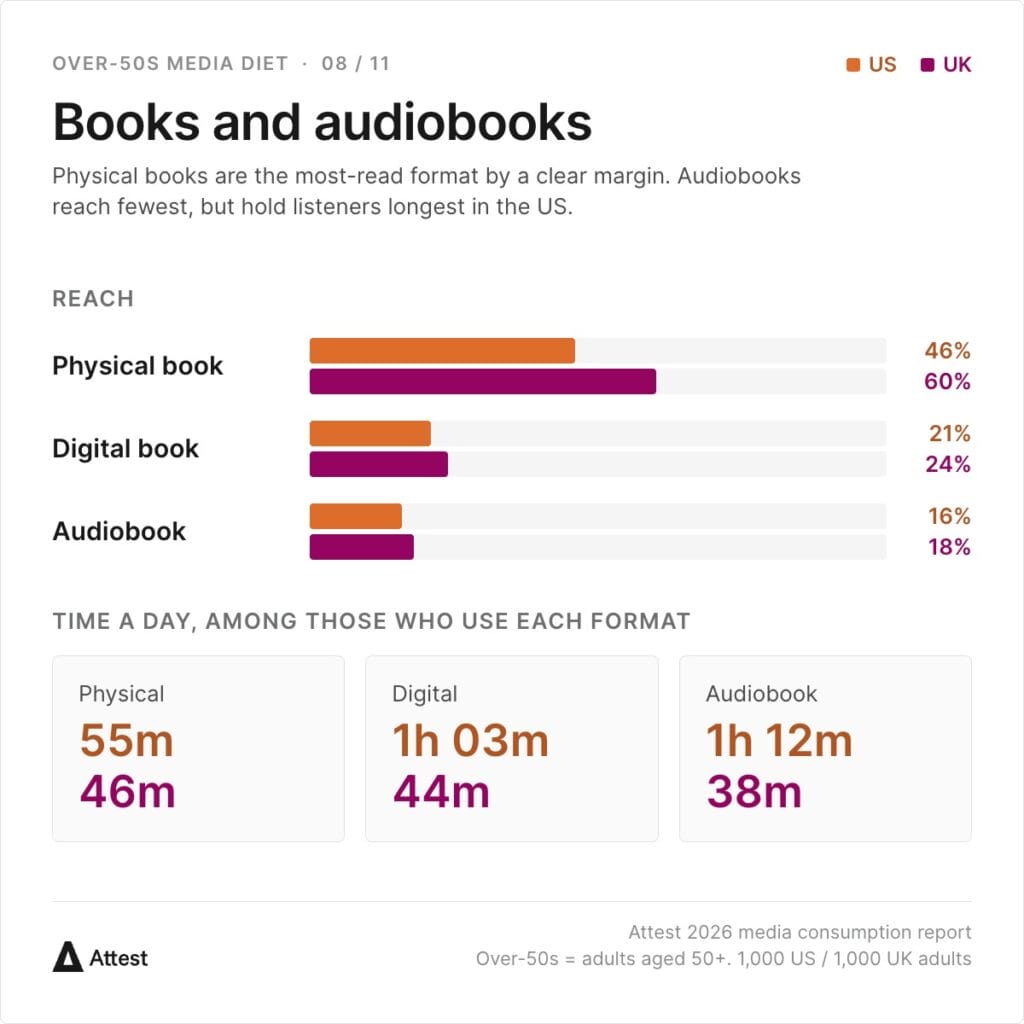
Physical books remain the most-read format for over-50s by a clear margin, reaching 46% in the US and 60% in the UK, with readers spending 55 minutes and 46 minutes with them respectively.
Digital books reach a smaller but still notable share (21% US, 24% UK), with longer sessions among US readers specifically (1h 03m, against 44m in the UK). Audiobooks are the least-reached format of the three in both markets (16% US, 18% UK), but among those who do listen, sessions run long, 1 hour 12 minutes in the US and 38 minutes in the UK.
Newspapers and digital content
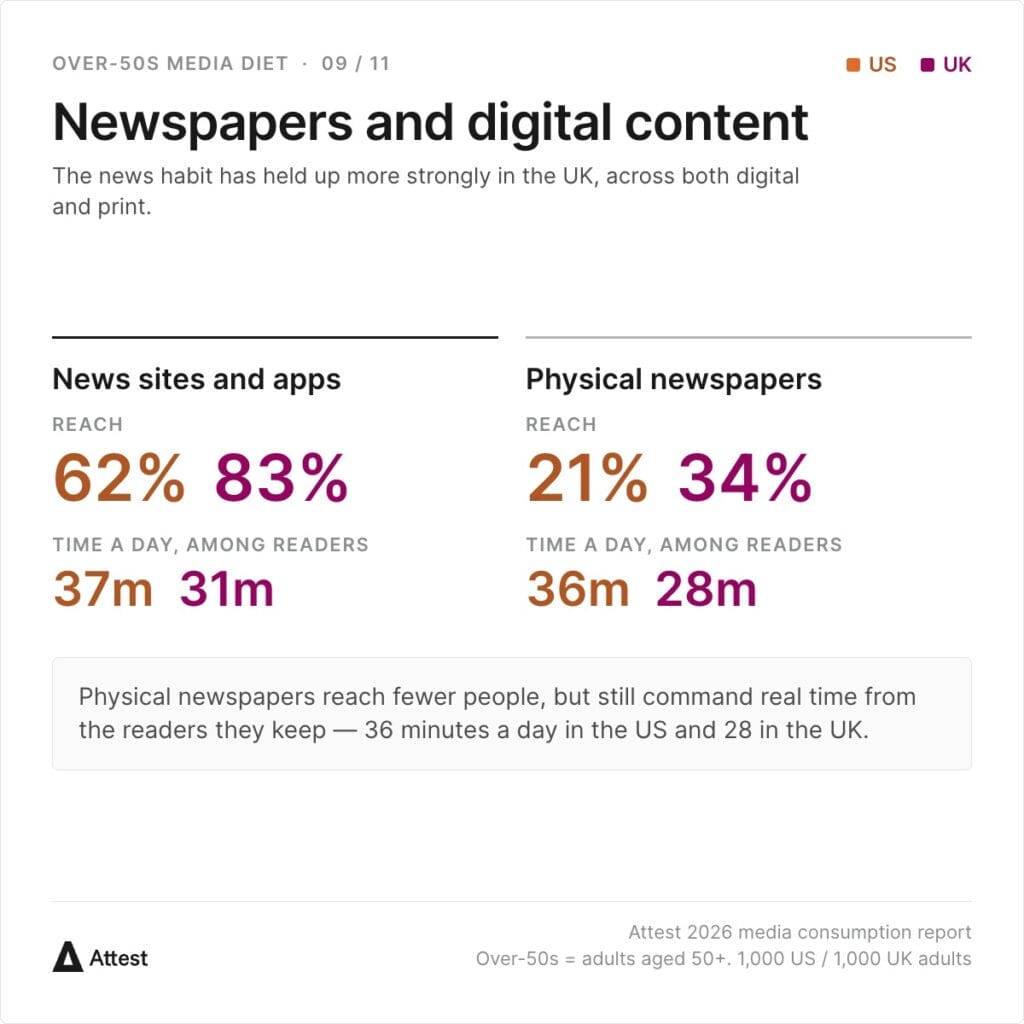
News sites and apps reach a solid majority of over-50s, 62% in the US and a striking 83% in the UK, with engaged readers spending 37 minutes and 31 minutes respectively.
Physical newspapers, while reaching fewer people overall (21% US, 34% UK), still command real time from their readers, 36 minutes a day in the US and 28 minutes in the UK. The UK’s notably higher reach across both digital and physical news suggests this age group’s news habit has held up more strongly there than in the US.
Search
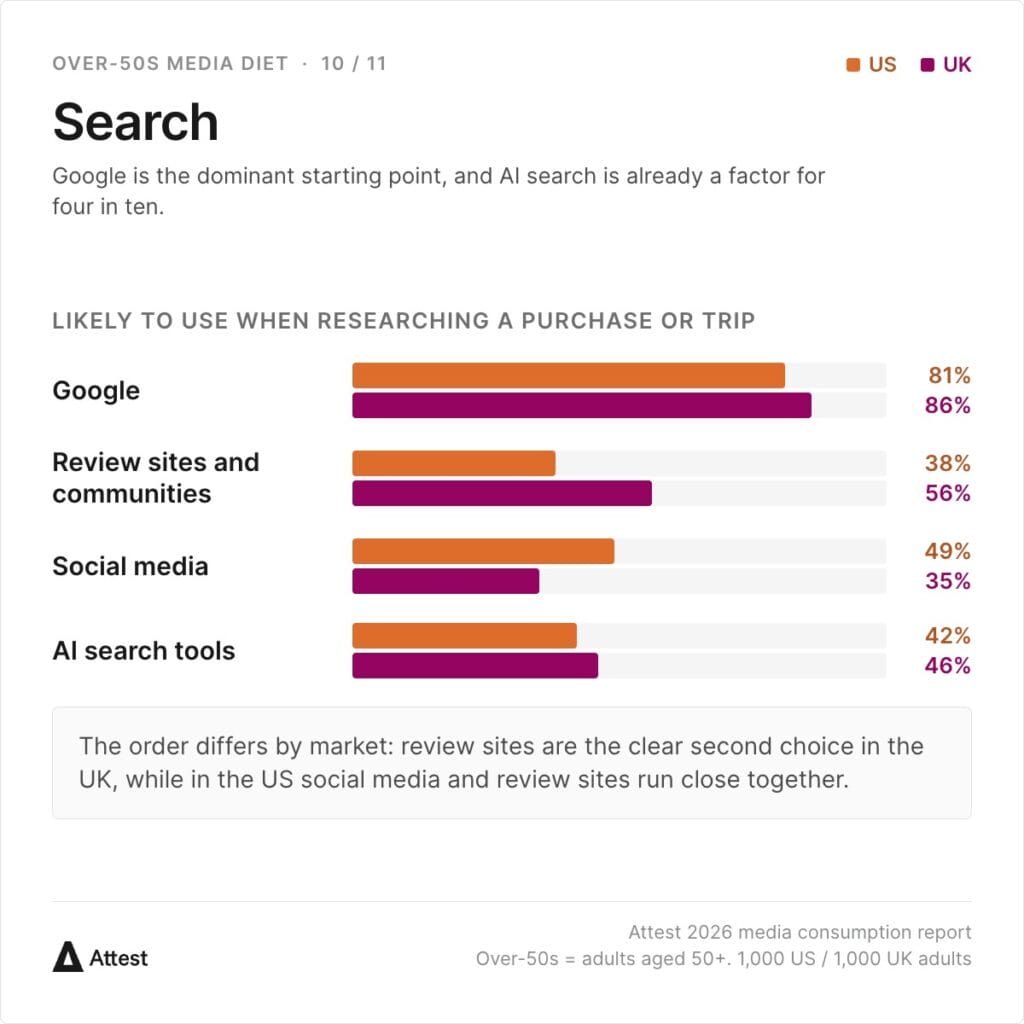
When researching a purchase or a trip, Google remains the dominant starting point for over-50s, likely to be used by 81% in the US and 86% in the UK. Review sites and communities are the clear second choice in the UK (56%), running well ahead of social media (35%) and AI search tools (46%).
In the US, the order is different: social media (49%) and review sites (38%) run close together, both ahead of AI search (42%). AI search adoption among over-50s, while lower than among Gen Z or Millennials, is far from negligible in either market, a meaningful share of this generation is already factoring AI tools into how they research a purchase.
What this means for ad tolerance
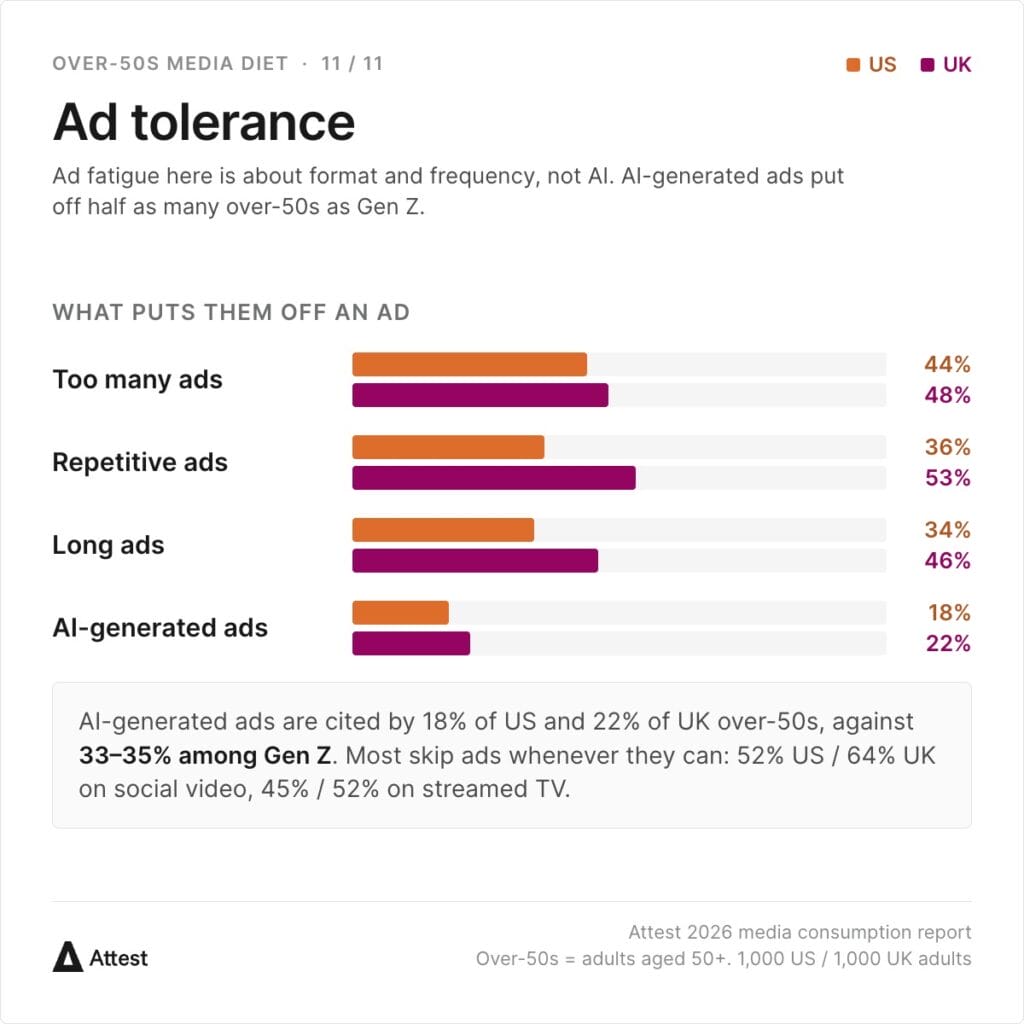
Ad fatigue among over-50s looks different in kind from the fatigue driving younger generations to disengage. Too many ads is the top complaint in both markets (44% US, 48% UK), followed by repetitive ads (36% US, 53% UK) and long ads (34% US, 46% UK). AI-generated ads, by contrast, are a comparatively minor concern, cited by just 18% of US over-50s and 22% of UK over-50s, far below the 33-35% seen among Gen Z.
When given the choice, most over-50s skip ads just like everyone else: 52% always or usually skip social video ads in the US (64% in the UK), and 45% do the same for streamed TV (52% in the UK). The takeaway for anyone planning creative for this audience: the format and frequency of an ad matter far more here than whether it was made with AI.
Get more insight into over-50s and other generations
This is just one slice of Attest’s 2026 US and UK media consumption research. Download the full report for the complete picture across every generation, and see how over-50s’ habits compare with Gen Z, Millennials and Gen X.

Methodology
Findings are drawn from Attest’s 2026 US and UK media consumption research, based on nationally representative samples of 1,000 adults in each market, supplemented by five years of Attest’s own tracking data. “Over-50s” refers to adults aged 50 and up to the oldest age captured in each survey, 66 in the US and 64 in the UK, throughout. All time figures in this piece, in the media diet chart and within each medium’s section, reflect the average among people who actually use that format, so that reach and engaged time can be read together; non-users are excluded rather than counted as zero. For reference, the population-wide daily total time across all formats tested, including non-users, is 9 hours 14 minutes in the US and 7 hours 52 minutes in the UK.