

You’ve launched your survey, watched the responses roll in, and now you’re staring at a dashboard full of data. The numbers are there, the comments are collected, but what does it all mean?
If you’re feeling overwhelmed by the prospect of turning hundreds (or thousands) of individual responses into actionable insights, this article will help you get started.
You’ll learn how to analyze survey data to spot meaningful patterns, avoid common analytical pitfalls and, most importantly, how to communicate your findings in a way that drives action across your team and organization.
What is survey data analysis?
Survey data analysis is the process of reviewing, cleaning, organizing and interpreting survey responses so you can understand what your audience is telling you.
Instead of looking at each answer on its own, survey analysis helps you see the bigger picture. It shows where patterns are forming and helps you understand how different groups respond. From there, you can start to interpret what the results might mean for your business.
When done well, survey analysis gives you insight you can use to shape product decisions, refine your marketing or improve the customer experience.
At its best, it helps you move beyond reacting to feedback. You start anticipating audience needs earlier, which gives your business a more proactive way to make important decisions.
Types of survey data
Most survey results include a mix of data types. Some responses are straightforward to measure and compare, while others help you understand the reasoning behind the numbers. Identifying the type of data you have is the first step to choosing the right analysis method. Below, we break down the main types.
Quantitative data
Quantitative data is information that can be counted or measured or, in other words, “quantified”. This type of data usually comes from closed-ended questions, where respondents choose from a fixed set of answers.
Here are a few common examples of data that can be quantified:
- age
- household income
- number of purchases in a given period
- NPS scores
- satisfaction ratings
- yes or no answers
- multiple choice selections
Closed-ended questions make quantitative analysis possible because they give you structured responses. But not all numeric responses behave in the same way.
The kind of analysis you can do depends on the measurement scale behind the data. There are two quantitative measurement scales: interval and ratio.
Interval data
Interval scales are where the gap between each value is consistent. In surveys, you’ll often recognize this as a rating scale, such as a Likert scale, that asks respondents to quantify satisfaction, agreement or likelihood.
Because each step represents the same change, you can compare differences between responses and calculate averages. However, because there is no true zero point, proportional comparisons don’t hold. For example, a score of 8 is not “twice as much” as a score of 4.
Ratio data
Ratio scales also have equal spacing between values, but they include a true zero point. Examples include age, spend, time and number of purchases.
Because ratio data is numeric, evenly spaced and anchored by a true zero, it supports the widest range of analysis. You can add:
- subtract, multiply and divide values
- calculate summary statistics like mean, median and mode
- compare averages across segments
- report proportional differences with confidence
No need to overthink the terminology here. The only thing you need to remember is that your data’s measurement scale affects what kind of analysis makes sense and how confident you can be in the conclusions you draw.
Qualitative data
Where quantitative data is essentially anything you can count, qualitative research data helps you understand what respondents think, feel or mean. Instead of selecting from predefined options, people answer in their own words, which gives you context behind the numbers.
You’ll typically see qualitative data in open-ended questions, such as:
- What nearly stopped you from buying?
- What do you wish this product did better?
- Why did you choose this brand over the alternatives?
Qualitative responses take longer to analyze, but they’re essential for explaining why patterns appear in your quantitative data.
Beyond open-text responses, you’ll also come across nominal and ordinal data in surveys. These come from structured questions, but they’re still considered qualitative because they describe categories and rankings, not precise numerical differences like quantitative data.
Nominal data
Nominal data groups responses into categories with no natural order. These are labels rather than rankings.
Examples include industry, country, device type or preferred brand. You can count how many responses fall into each category and compare distributions across groups, but you can’t rank the options or calculate meaningful averages.
Nominal data is most useful for segmentation. It helps you understand who your respondents are and how different groups behave.
Ordinal data
Ordinal data groups responses into categories that follow a clear order. You’ll typically see this in rating or frequency questions, such as satisfaction scales (very dissatisfied to very satisfied) or frequency scales (never to always).
This allows you to compare direction and relative position, such as whether one group is more satisfied than another. Because the gaps between each option aren’t equal, averages should be interpreted with care.
Ordinal data is best suited to comparing trends and direction rather than precise numerical analysis. It’s especially useful for tracking sentiment, measuring change over time and understanding how opinions or behaviors shift.
Key considerations before you start analyzing your survey results
Now that you know what kind of data you’re working with, it’s time to make sure it’s ready for analysis.
Before you start rummaging around in your unstructured data, take a moment to run through these pre-checks. They should set you up to draw meaningful conclusions from your data.
“Did I get enough responses to my survey?”
It’s easy to assume that more responses automatically mean more reliable results, but it’s not always that simple. When thinking about if you have enough responses, consider:
- Who didn’t respond? Non-response bias can skew your results if certain groups are less likely to participate.
- What’s my response rate? Always calculate and report this (responses divided by invitations sent). Even a seemingly low survey response rate (5-10%) can produce reliable estimates if your sample size is large enough. Note that response rate isn’t a concern when using an online survey panel, instead, use a survey sample size calculator to work out how many responses you need before you launch.
- Do I have enough respondents per subgroup? If you plan to analyze differences between segments (like age groups or customer types), each segment needs sufficient representation.
“How confident should I be in these results?”
Before you proclaim that “62% of customers prefer our new design,” understand the statistical reliability of that number. Here are the three components of statistical reliability you must consider before analyzing your survey data:
- What is my confidence level? This is how sure you want to be that your results aren’t just a fluke. In most survey research, the industry standard is 95%. This means that if you ran the same survey 100 times, you’d expect to get the same results 95 times out of 100.
- What’s my margin of error (MOE)? This is the amount of error you can expect based on your sample size (e.g., ±3%). It represents the gap between your sample’s opinion and the actual opinion of the entire population. Generally, the smaller your sample size, the larger your margin of error.
- What’s my confidence interval? This is the final range where the true answer likely sits, calculated by applying your MOE to your result. For example, if your survey says 62% of people prefer the design with a 3% margin of error, your Confidence Interval is 59% to 65%.
We spoke to Nicholas White, Head of Strategic Research at Attest, about how teams can analyze survey results more effectively. When it comes to statistical reliability, his advice is to be clear about uncertainty rather than glossing over it:
“Always communicate these limitations when sharing your findings. Instead of saying ‘62% prefer us,’ saying ‘We are 95% confident the true preference is between 59% and 65%’ isn’t just good practice — it’s ethical reporting.”
“Are my responses representative of my target population?”
Your survey might have lots of responses, but if they’re all from one demographic when your customer base is diverse, you’ve got a problem:
- Compare respondent demographics to your overall population. If 70% of your customers are millennials but only 30% of survey respondents are, your results will likely be skewed.
- Consider weighting your data if certain groups are underrepresented. This adjusts the influence of each response to better reflect your actual population.
- Build in representativeness from the start:If you’re using an online panel survey platform like Attest, you can sidestep this issue from the start either by running nationally representative surveys or by setting custom demographic quotas to ensure your sample matches your target population.
“Are these differences actually meaningful?”
Distinguishing between a “statistical” difference and a “meaningful” one is key to accurate analysis. Here is how to tell whether a result is worth a closer look:
- Statistical significance tells you whether an observed difference is unlikely to be due to random chance alone. For example, if you survey 10,000 customers and find that 50% of Group A are satisfied compared to 51% of Group B, that 1 percentage point gap may be statistically significant simply because the sample is so large.
- Effect size: This measures how big a difference is, or how strong a relationship is, between variables. In the example above, the result may be statistically significant, but the difference itself is still very small.
- Practical significance asks, “Is this difference big enough to care about?” A 2% improvement might be statistically significant but not worth a major investment to achieve.
“What’s the story behind the numbers?”
Quantitative data can tell you what’s happening, but qualitative responses often reveal why:
- Look for patterns in the comments that might explain trends you see in your numerical data.
- Don’t skip open-ended responses just because they take longer to analyze. They often contain your most valuable insights.

Consumer insights with expert support
Intuitive, easy-to-use tech combined with human research expertise at every step — that’s what you get with Attest. Start gathering quality insights today!
Book a demo6 Steps to analyze your survey data
Now let’s get into the specific steps to take when you start your survey analysis.
1. Look at the results of your survey as a whole
Before you analyze your survey responses, familiarize yourself with all the overall survey data, lay out your expectations and learn what exactly is in there.
To begin, look at the results and see what stands out to you at first glance. What were you expecting to see or most curious about?
It’s okay to have assumptions: simply make them clear to yourself before the survey is launched, and then see if they are debunked or confirmed.
You can also compare the results to similar surveys or studies to see if they’re in line with those findings.
Once you’re familiar with all that data, it’s time to zoom in on which results are most telling. The next few tips will help you find valuable insights in your survey data.
2. Dig into the segments and demographics
Next, break your data down into meaningful groups. Looking at results as a whole will only get you so far; the real insight comes from understanding how different groups respond.
From there, you can take things further by creating segments. A segment is a group of respondents defined by one or more conditions, such as demographics, behaviors or answers to specific questions. This allows you to analyze more specific audiences, like “younger non-customers” or “frequent users.”
Common segments to explore include:
- demographic segments like age, gender or income
- behavioral segments like usage or purchase history
- attitudinal segments like satisfaction, perception or intent
For example, women overall might report high satisfaction with your product. But when you break that result down by age, you may find that younger women are significantly less satisfied and pulling the average down.
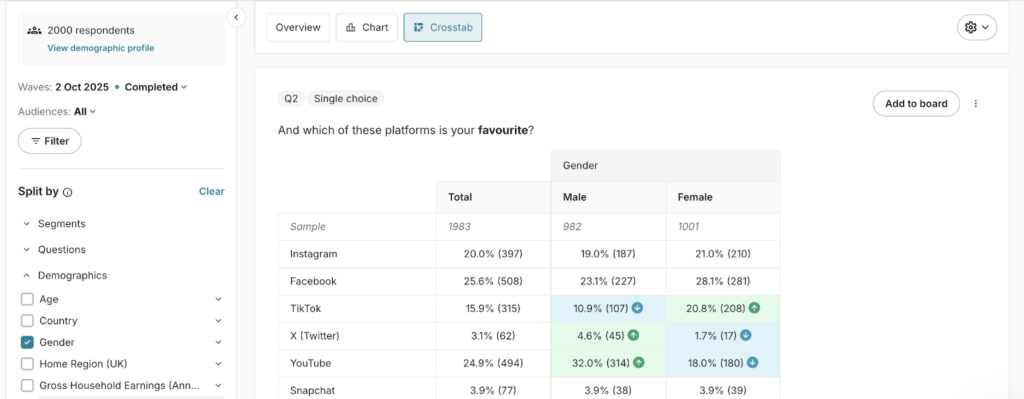
Once you’ve identified the groups you want to explore, the next step is comparing them side by side. That’s where crosstabs come in. Crosstabs let you view responses to one question across multiple groups at the same time, so you can find meaningful differences in your data.
For example, instead of only seeing the overall ranking of favorite platforms, a crosstab can show how preferences differ by gender.
In the image below, we can clearly see that YouTube is more popular among men, while Facebook and TikTok perform more strongly among women. That gives you a much sharper sense of who’s driving the average and where to investigate further.
“It’s easy to over-segment. Small groups can be noisy, and more segments don’t always mean more insight. The goal is to focus on the differences that actually help you understand what’s driving the result.” — Nicholas White, Head of Strategic Research at Attest
3. Compare responses to different questions to find deviations
It’s important to check for deviations before drawing conclusions. You may find you need to remove responses from people who don’t appear consistent in their answers.
For instance, someone might score you highly on product quality, but further down the survey they give a different opinion, in an open-ended question.
When comparing data, try to identify these types of patterns — and don’t just focus on the most positive answer for you.
If you’re using Attest, data quality checks automatically remove low-quality responses before you even begin your analysis, so you can have greater confidence in the data you’re working with.
4. Find connections between specific data points with layered data
Once you start layering survey data and comparing variables, the next step is understanding what those relationships mean.
Not all connections in your data should be interpreted in the same way. Some relationships are meaningful, while others can be misleading if you don’t look at them carefully.
Keep in the following in mind when you’re trying to understand the relationships in your data:
- Confounding variables are hidden factors that influence both variables and can create misleading relationships. For example, more experienced users might both use more features and report higher satisfaction, making it look like feature usage drives satisfaction when experience is actually the underlying factor.
- Correlation means two variables move together. For example, customers who report higher satisfaction may also be more likely to recommend your product.
- Causation means one variable directly influences another. For example, improving onboarding might lead to higher satisfaction scores.
5. Compare new data with your other data and insights
If you have any past data available, use it! See how some things have changed and try to find explanations for them. Has customer satisfaction decreased drastically, and at the same time you’re busier than ever? These could be related: for instance, you’re selling more, resulting in understaffing and longer waiting times.
Comparing your new raw data to past industry insights can also help you gather fresh ideas for the future. Take Bloom & Wild, who uncovered that red roses for Valentine’s are a thing of the past:
We found that 79% of people would prefer to receive a thoughtful gift rather than something traditional, like red roses. 58% of people thought red roses were a cliché.
And they actually came bottom as the least favorite gift that people had received for Valentine’s Day. So, that gave us confidence that we had correctly sensed growing reluctance towards those sort of Valentine’s Day clichés. — Charlotte Langley, Brand & Communications Director at Bloom & Wild
Read more about how Bloom & Wildfollowed up their hunch with research, and saw big results.
6. Be critical, always
Data analysis requires you to be skeptical. Be aware of how ‘true’ the data really is.
It can help to look into whether you have statistically significant research insights. A statistical significance test compares two groups and tells you whether a particular insight comparison is a result of chance or whether there’s more of a causal link.
Summary: How analyze your survey data
| Step | What to do | What to look for |
| 1. Look at the results as a whole | Scan all responses before you dive into specifics and revisit your original hypotheses. | Big patterns, surprises vs expectations, and any early “wow” moments in the topline data. |
| 2. Dig into segments and demographics | Break results down by key audience segments and demographic groups. | Which groups over or underperform the average, where satisfaction drops, and which niches behave differently. |
| 3. Compare responses across questions | Cross check how people answered different questions in the same survey. | Inconsistencies, contradictions, and patterns across scaled, multiple choice, and open ended questions. |
| 4. Find connections with layered data | Explore how different variables move together, not just in isolation. | Possible correlations, causation clues, and signs of confounding factors that might explain results. |
| 5. Compare new data with other data and insights | Benchmark this survey against past research and external market data. | Shifts over time, confirmation or contradiction of earlier findings, and signals that your market is changing. |
| 6. Be critical, always | Stress test your findings before you act on them. | Whether results are robust, statistically significant, and genuinely actionable rather than noise. |
How to present your survey results

Visualizing your findings effectively
Start by choosing the right format for what you want to show. A simple overview can work well for quick exploration and sense-checking responses. Charts are useful when you want to compare results visually, while tables are often better for more detailed comparisons, especially when charts become too dense or when you need to examine intersections between groups.
Once you’ve chosen the format, match the chart type to the story your data is telling:
- Bar charts work well for comparing categories
- Line graphs are better for showing trends over time
- Pie charts can illustrate proportions, but use them sparingly because they become harder to read when there are too many segments or the differences are small
Whatever format you use, make it easy to read. Include clear titles, labels and legends, and use color strategically to draw attention to key findings. At the same time, make sure your visuals remain accessible to colorblind viewers.
Nicholas also recommends keeping visuals simple and resisting the urge to overload charts with too much data. The clearer the visual, the easier it is for your audience to understand the point you’re making.
He also noted that in some cases, a well-chosen stock image can support the narrative more effectively than another crowded chart.
Tell a story with your data
Don’t just report numbers: connect them to business implications. Start with your most important finding, provide context about why it matters and explain what it means for your organization.
Use a logical flow that guides readers from discovery to actionable insights. Include relevant quotes from open-ended responses to bring the data to life and make it more relatable.
As Nicholas puts it, “Share anecdotes to build the emotional connection with stakeholders to keep them engaged throughout the story.” That emotional connection can make your findings easier to understand, remember and act on.
Summarize implications and next steps
Always conclude your analysis with clear recommendations, for example:
➡️ What should your team do differently based on these findings?
➡️ Which insights require immediate action versus longer-term strategic planning?
Prioritize your recommendations and include specific, measurable next steps that stakeholders can act on. This transforms your analysis from interesting information into a roadmap for improvement.
Common mistakes in survey data analysis and how to avoid them
Survey analysis can go wrong in predictable and sometimes surprising ways. We also asked Nicholas for his perspective on the most common pitfalls teams run into and how to avoid them. Here are the mistakes that come up most often, plus what to do instead.
❌ Misinterpreting small sample sizes
A small sample might give you directional insights, but don’t treat findings from 20 respondents as gospel truth for your entire customer base.
Always report your sample size alongside your findings and acknowledge when your data is exploratory rather than conclusive.
If you need to make decisions based on limited data, treat them as tests rather than permanent changes.
❌ Overgeneralizing findings
Just because 80% of your survey respondents prefer feature A doesn’t mean 80% of all your customers do, especially if your survey only reached certain demographics or customer segments.
Always consider who didn’t respond and whether your sample truly represents your broader audience. Be specific about the limitations of your findings when presenting results.
❌ Reporting findings without connecting them to insight
Another common mistake is stopping at the findings. As Nicholas points out, teams often get so focused on reporting what the data says that they don’t spend enough time on the broader insight and recommendations those findings should lead to.
Before running the data analysis, Nicholas recommends revisiting the original research objectives. This helps bring focus to the work while also highlighting the gaps and needs of the project.
❌ Ignoring qualitative data
Don’t underestimate the value in understanding the “why”. Open-ended responses often contain your most valuable insights and can explain puzzling trends in your quantitative data. So it’s a good idea to spend time analyzing these answers.
❌ Over-relying on external benchmarks without context
Industry averages can provide useful context, but your business isn’t average. A Net Promoter Score that’s below industry standard might still represent improvement for your company, or it might reflect different customer expectations in your specific market. Use benchmarks as reference points, not absolute measures of success or failure.
❌ Focusing only on certain figures
Yes, 73% of respondents might have selected that feature, but did you notice that only 12% ranked it as their top priority? Context matters. Always look beyond the most prominent statistics to understand the full story your data is telling.
Nicholas also warns against trying to present everything at once: “When every data point for every question makes it into the final report, the story gets harder to follow.”
A stronger approach, he says, is to focus on the findings that matter most to your audience and include the rest in an appendix for anyone who wants the full detail.
❌ Ignoring segments and outliers
If you just look at averages, you’ll get an average marketing strategy that doesn’t activate your most valuable customers.
Averages look neat on paper, but they often mask crucial differences between customer segments. Your power users might have completely different needs than your casual browsers.
Nick’s advice here is to get clear on your audience before you get deep into the analysis. “If you aren’t sure which groups matter most, the analysis becomes broad and slow. Knowing which demographics or segments you want to look at makes the analysis more focused and more useful for the stakeholders who need to act on it.”
❌ Confusing correlation with causation
Just because two metrics move together doesn’t mean one causes the other. That apparent relationship between customer age and product satisfaction might be explained by a third factor you haven’t considered. Always ask: “What else could explain this pattern?”
❌ Approaching data with pre-existing biases
Beware of cherry-picking. When you’re convinced your new marketing campaign is brilliant, you’ll naturally gravitate toward the survey data that confirms your belief. Start your analysis by actively looking for data that challenges your assumptions.
How to improve survey data quality

The quality of your analysis is only as good as the data you’re analyzing. Here are practical strategies to ensure your survey data is as reliable and valuable as possible.
Survey design improvements
Use these tips to strengthen your survey design and prevent low-quality responses before they happen.
- Keep it concise: Respondent fatigue leads to rushed, low-quality answers. Aim for surveys that take under 10 minutes to complete.
- Use simple, clear language: Avoid jargon, double-barreled questions and complex phrasing that could confuse respondents.
- Implement logic and skip patterns: Show respondents only the questions relevant to them based on their previous answers to improve completion rates and data quality.
- Include attention checks: Incorporate questions that verify respondents are paying attention, such as “Select ‘somewhat disagree’ for this question”.
- Balance your scale options: Provide an equal number of positive and negative options in rating scales to avoid bias.
During data collection
As responses come in, use these checks to maintain quality and quickly spot issues.
- Pilot test your survey: Run your survey with a small test group first to identify and fix any issues before full launch.
- Monitor responses in real-time: Check early responses for potential issues with question interpretation or technical problems.
- Offer appropriate incentives: Provide reasonable compensation that motivates thoughtful participation without attracting respondents who are only interested in rewards.
Data cleaning techniques
After the survey is done, apply these cleaning steps to remove noise and keep only reliable data.
- Remove speeders: Flag and review responses from participants who completed the survey significantly faster than the average time.
- Address straight-lining: Identify and consider removing respondents who select the same answer option for all questions in a matrix.
- Check for logical inconsistencies: Look for contradictory answers across related questions that indicate the respondent wasn’t answering truthfully.
- Analyze open-text responses for quality: Flag responses containing gibberish, irrelevant content or copied text.
Turn survey data into insight faster with Attest
Analyzing survey data doesn’t need to be slow or manual. With the right tools in place, you can move from raw responses to clear insights much faster and spend more time acting on what you find.
Attest supports the full workflow, from data collection through to analysis and reporting. Our platform also takes much of the manual work out of survey analysis.
Here are the AI features that make it easier to get to actionable insights faster:
- Key Findings: This feature gives you an instant executive summary of your results to help you quickly understand the overarching story before diving deeper into specific segments or demographics.
- Auto-generated boards: From there, auto-generated boards turn your data into ready-made reports, with charts built around the most important findings in your survey. This makes it easier to share insights with stakeholders and enables you to spend more time interpreting the results rather than building slides.
- Compass: For more hands-on exploration, Compass, Attest’s AI co-pilot, lets you interact with your data in a more flexible way. You can ask questions, generate charts, apply filters and refine outputs without needing to manually navigate the platform. This makes it easier to tailor your analysis and present findings in a clear, visual format.
- Open-text analysis: Attest also helps simplify one of the most time-consuming parts of analysis: working with open-text responses. You can quickly summarize verbatim answers using AI, then code and group them to quantify themes. This reduces manual effort and makes qualitative data easier to use alongside your quantitative results.
The result is a faster, more focused analysis process. Instead of spending time pulling data together, you can focus on understanding what it means and communicating it effectively.
Looking for the best survey tool for your next project?
Check out our guide to the top 9 survey tools and see which one fits your needs best.
Read the guideMost survey tools come with reporting features and a dashboard that presents all the data, but it’s you who has to play with filters to find significant connections in the survey results. You can then create graphs that help you identify trends and track data.
It all starts before creating a survey: what is it you want to measure? Set a goal for your survey and build it based on that. You can analyze your survey results easily in your dashboard, playing around with filters to find connections.
With a lot of critical thinking, being wary of assumptions and keeping statistical significance in mind. For accurate survey data analysis, make sure you remove any data that’s wrong and incomplete before you start drawing conclusions. Plus, if possible, test the accuracy of the data with past or other relevant survey responses.
It all starts with formulating clear and concise research questions, and going from there. Select the right respondents and a tool that helps you analyze the results quickly and accurately.
Mixing and matching qualitative feedback with demographic data and numbers is tricky. Make sure you can lead open-ended responses back to specific groups of people and see how their answers match to other questions.