

What survey question types are there?
Single choice
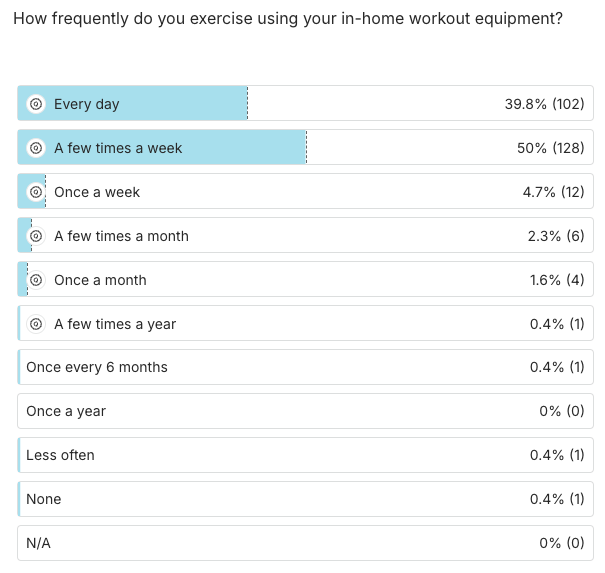
Single choice questions help you learn what the top answer is for your respondents by forcing a clear decision on the question. Example of a single-choice question
Example
This single-choice question is from a survey to US consumers about home workouts and workout equipment.
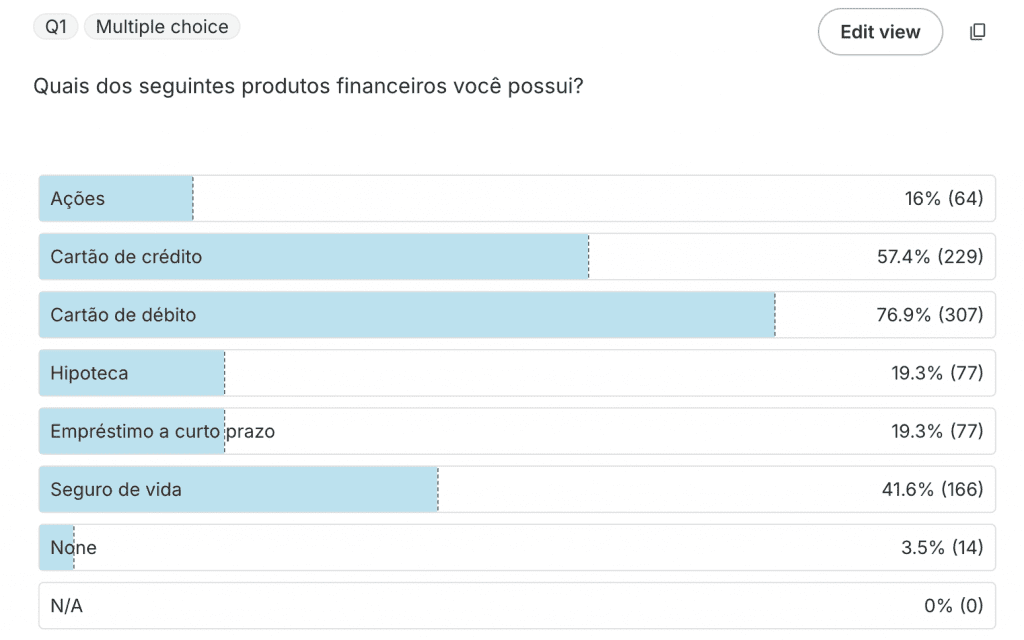
Multiple choice
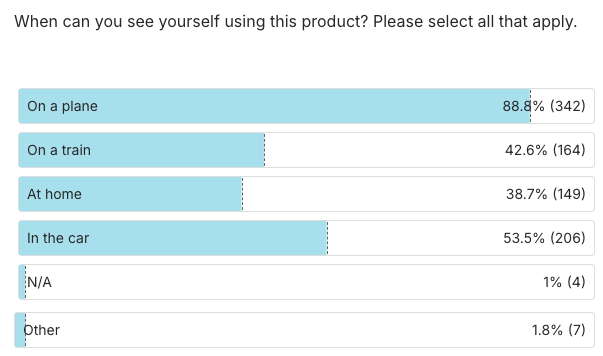
Multiple choice questions allow you to learn a variety of preferences from your target audience, as respondents can share with you what appeals to them from all of the answer options.
Example
This multiple-choice question is from a new product development survey about a new product for people to use when they’re traveling.
Grid question
You use grid questions to present multiple items to respondents, and ask for a multiple- or single-choice answer in response, with the answer options remaining the same across all items. Grid questions are often used to establish the frequency of different consumer behaviors, or preference for different items, with a fixed Likert scale offered as a response to all items.
Example
This grid question is from a brand tracking survey about make-up in the UK.
Ranking questions
Ranking questions help you learn respondents’ clear preferences from all options listed since they are asked to put them in order. With the Attest platform you can also see the aggregated ranking score from all respondents, giving a relative prioritization.
Example
This ranking question is from a brand tracking survey about plant-based milks.
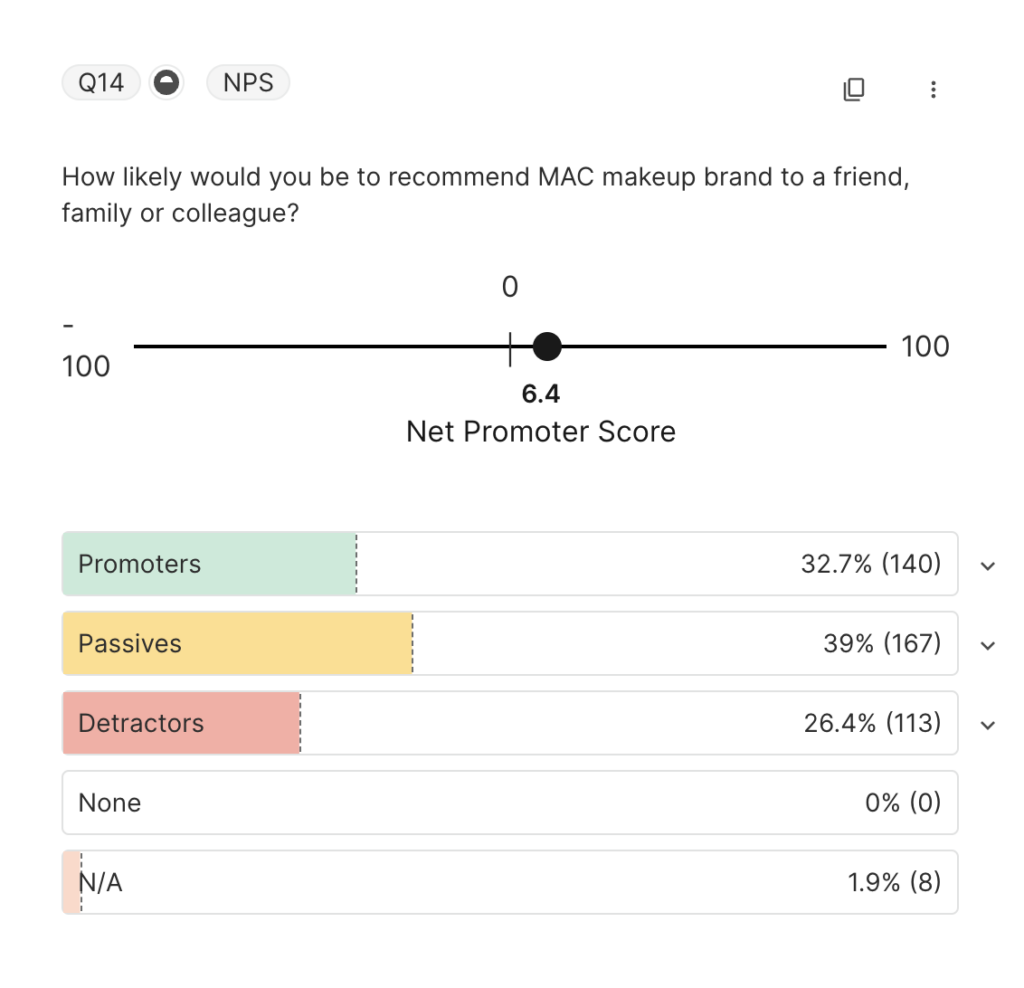
Net Promoter Score (NPS)
NPS is a super important metric to learn how your brand is doing over time. It’s best to use an NPS question in surveys that you will run consistently over certain periods (e.g. quarterly) and then compare consumers’ likelihood of recommending you over time as you carry out more brand-building activities.
Example
This NPS question is from a brand tracking survey about makeup, sent to consumers in the UK.
Likert scale
A Likert scale is a gradual scale measuring a consumer’s attitude to a statement. A stand-alone Likert scale can easily be created using a single choice question type, or used as the answer options in a Grid question.
Example
The scale should be evenly weighted between positive and negative responses, with a central point for a neutral response. For this reason, Likert scales often have 5 points, for example:
- Strongly agree (with statement)
- Slightly agree
- Neither agree nor disagree
- Slightly disagree
- Strongly disagree
Open text
Open text helps you learn the context behind why a respondent answered the way they did. It’s great to put them after a single choice question to understand in greater detail why a certain answer was selected, or add them after other question types to get more context around any aspect of a question or response.
Example
Here’s an example of an open-text question from a tracker about UK food brands.
Video responses
This is a type of qualitative question where respondents record a video of their response.
It gives you a deeper level of detail because you get verbatim feedback from your respondents. But because respondents record their answers in their own time—rather than in a moderated setting like a focus group—it can be a more cost-effective and faster way to gather qualitative data.
Learn more about video responses—why you might want to gather video responses, how to do it and the essential dos and don’ts.
How to write good survey questions
How to get accurate answers
If respondents aren’t questioned in the right way, they won’t open up and give you the realistic, insightful answers you need. You don’t want to waste time and money on answers you later decide are unimportant.
These steps ensure not a single question is wasted. Once you learn them, you can apply them to all your future research projects.
Ask yourself: Will this question give me good insights?
Every question you write should give you information that allows you to say: “Great, now I have this knowledge, I can do X!”. Reverse engineering each question from your desired answer will make sure all the data you get is actionable.
Choose between quantitative or qualitative, or use a mixture of both
Quantitative data is simpler to interpret, and produces results that can be acted on relatively quickly.
Qualitative data takes longer to interpret because it requires someone to read and process each response. But it does allow respondents to express their opinions in their own way, revealing unique insights you can’t access through numbers or pre-formatted answers.
Often surveys include a mix of quantitative and qualitative questions, but this will be determined by the aim and scope of the survey.
Don’t write too many questions
Attest’s dashboard caps surveys at a maximum of 40 questions, optimized to avoid fatigue and produce the highest quality responses.
If you think you need more than 40 questions, consider reducing the scope of the survey or splitting it into a series of smaller surveys for more engaged responses.
Running more focused surveys, more frequently, will yield much better results than saving everything up and asking everything you’ve ever wondered, all in one go. The ‘kitchen sink’ approach can result in an unfocused survey that confuses respondents, de-motivates them, and provides less value.
… and mix up the question types
Even a relatively short survey that repeats the same question type will bore people. Use a mixture of types to make sure respondents stay engaged.
Use plain language
Don’t assume that respondents understand your business jargon, acronyms or slang. Engaging consumers with a friendly, conversational tone encourages honesty and commitment, leading to more reliable results.
Unsure about the right way to phrase questions? Get in touch with Attest, or run questions past a colleague to make sure they’re easy to understand.
Good and bad examples of survey questions
Here are some tips that are specific to how you actually write your questions.
Avoid double negatives
Don’t bamboozle your respondent by expecting them to unpick a double negative.
| ❌ Bad example | ✅ Good example |
| Do you think a brand’s ethics are not insignificant? | How significant are a brand’s ethics to you? |
Use consistent scales throughout
Choose a consistent answer range (and stick to it).
| ❌ Bad example | ✅ Good example |
| How many stars would you give Starbucks out of 5? Rate Dunkin’ on a scale of 1-10. | Rate Starbucks on a scale of 1-5. Rate Dunkin’ on a scale of 1-5. |
Avoid compound concepts
Ask one question at a time—if you combine ideas, your insights won’t be reliable.
| ❌ Bad example | ✅ Good example |
| Name one fashion brand you think is reasonably priced and good quality. | Name one fashion brand you think is reasonably priced. Name one fashion brand you think is good quality. |
Avoid leading questions
You want honest answers. Don’t lead respondents towards a certain answer that’s favorable to you.
| ❌ Bad example | ✅ Good example |
| How awesome was our customer service? | How was our customer service? |
Offer mutually exclusive options
For single and multiple choice questions, make sure you don’t give options that overlap.
| ❌ Bad example | ✅ Good example |
| $5-10; $10-15; $15-20 | $5-10; $11-15; $16-$20 |
How to increase survey engagement
When running a piece of research, you also want your respondents to be engaged with the content so they give you high quality answers. Here are our top tips for increasing engagement.
Don’t bore people
Avoid repetition—AKA, too many similar questions in a similar format. This is dull for the respondent and they risk losing concentration.
Use open text sparingly
Be wary of using too many open text or grid questions. These are more challenging for respondents and can lead them to get tired with your survey.
Guide respondents through your survey
Use text cards to pace the survey—explaining what’s coming up next is helpful—particularly if you are switching subject matter.
Be clear and relevant
Remember, your respondent has limited time (and patience). Make sure your questions are simple, make sense, are relevant to the respondent, and that it’s clear what you are asking them to do. If in doubt, get a second opinion from a friend, colleague, or from Attest’s Customer Research Team.
How to avoid bias in your survey
You want respondents to tell you the truth.
Hearing the truth might hurt sometimes. It might take your marketing, product or sales in a completely new direction. But you’ll be thankful later when you have a product or service that is EXACTLY what consumers want.
It’s therefore super important that you remove any chance of biasing your respondents’ answers.
Here are a few simple and effective ways to avoid bias in your surveys.
And here’s the TL;DR list to kick you off:
- Avoid yes/no questions
- Don’t ask leading questions
- Order questions and answers to avoid bias
- Be anonymous wherever possible
- Don’t feed answers to your respondents
- Clarify your language
- Look out for (and remove) assumptions
Avoid yes/no questions
Try to avoid questions with yes/no answers. This is because respondents have a tendency to want to say yes—it’s the positive, aspirational answer. This is called acquiescence bias.
For example, instead of “do you find beautiful packaging essential when purchasing dark chocolate?” Ask, “which of the following do you find essential when purchasing dark chocolate?”
Don’t ask leading questions
Look out for leading questions, which push respondents to respond in the way you want them to. This sometimes results in confirmation bias. You can do this by avoiding unnecessary adjectives.
For example, don’t say “What do you think of [brand’s] delicious dark chocolate”. Instead, say “[brand’s] dark chocolate.”
And don’t forget that scale question answers can also be leading. Make sure your answers for scale questions include positive and negative options, not just all positive options.
Order questions and answers to avoid bias
The way you order your questions and answers has an effect on how people respond. This is called order bias.
Order bias in questions
Order bias can happen when a question you’ve asked (or a media asset you’ve presented) has an impact on how your respondents think about the rest of the survey.
For example, if you’re presenting a series of adverts, all subsequent adverts will likely be compared to the earlier ones in the respondent’s mind, even subconsciously.
Here’s what you can do to avoid order bias in questions:
- Don’t give away answers to later questions with earlier ones. Think about the order in which you ask questions to make sure you move from the most general at the start to the most specific towards the end of the survey.
- Randomize questions wherever possible. Some platforms—like Attest—have this feature built in, allowing you to shuffle the order of your questions.
Order bias in answers
The answers people give can also be influenced by the order in which you present them. People are more likely to select the answer(s) towards the top of the list. If this happens, you won’t have a true representation of your audience’s views.
Any good survey platform will allow you to randomize answer options. It makes sense to do this for all answers to all questions—except when you’re using scale answers (e.g. very likely, likely, neither likely or unlikely…).
Be anonymous wherever possible
Don’t give away who you are! If you do, this can cause sponsor bias—when respondents feel they need to give positive answers about the brand asking the questions.
And it also stops people from letting their perceptions of your brand cloud their answers. Yes, you need to know what consumers think about your brand—that’s why we go on about brand tracking!—but there are times when you want to know what people think regardless of your brand.
For example, if you’re running new product development research, you want to know what people think about that exciting new product or service you’re considering. You don’t want their opinions about your brand—positive or negative—to influence the product insights.
Don’t feed answers to your respondents
Surveys are often designed to flow from the most general topics to the most specific. This is to make sure certain ideas or feelings aren’t brought to the front of mind because they were mentioned in previous questions.
If possible, try to avoid emotionally-loaded language (words and phrases with positive or negative descriptors beyond their literal meaning) entirely. Be as neutral as possible.
Clarify your language
Avoid confusing respondents, or leaving room for interpretation in answers by objectifying your language.
For example, instead of using ‘recently’, ‘often’ or ‘infrequently’, specify the time frame as ‘daily’, ‘weekly’, or ‘once per year’.
And don’t assume that respondents understand your business jargon, acronyms or slang. Make sure you know how your ideal customer speaks—this should help you use the right language.
Look out for (and remove) assumptions
Avoid making an assumption that forces respondents to answer untruthfully. You can correct this easily if you consider whether or not you should include the options ‘None’, ‘N/A’ and ‘Other’ in your list of answers.
For example, asking ‘Which type of laptop do you own?’ assumes that the respondent owns a laptop, so you’ll want to make sure they can answer truthfully by adding options for ‘None’ or ‘N/A’.
And look out for places where you’ve assumed a positive or negative response, by wording your questions to allow for either option.
Instead of ‘What did you enjoy about your last holiday?’, reword this as two distinct questions: ‘What did you think about your last holiday?’ ‘Very enjoyable’, ‘Quite enjoyable’ etc. And remember to add an option for the response ‘I haven’t taken an international holiday [in the last year].’
Then follow this up with a free text question like ‘Why do you feel this way?’
Choosing your ideal sample size
On the one hand, you might feel you want as many people’s views as possible. But you might also have heard that, beyond a certain point, more respondents doesn’t equal more robust insights. It’s actually possible to reach ‘peak robustness’.
It’s up to you to balance your need for reliable research with the practical requirements of your research project.To put it bluntly, the more respondents you get, the longer it’ll take (and the more money it’ll cost).
Choosing a robust sample size
Luckily, there are some standard formulae to think about when choosing your sample size.
The calculation takes into consideration three factors:
- Confidence level
- Margin of error
- Survey type
This will then give you the minimum number of respondents needed to achieve the level of confidence you want.
Adding to the sample size can increase your confidence in the data, and will deliver results you feel comfortable presenting to your team and partners.
A confidence level of 95% and a margin of error under 5% are the industry-wide accepted minimums for good consumer research.
As a simple guide, for data that provides a nationally representative sample of the UK’s working age population (roughly 45 million people), here are the sample sizes to bear in mind.
3,500 responses
- Confident level: 99%
- Margin of error: 2%
2,000 responses
- Confidence level: 95%
- Margin of error: 2%
1,500 responses
- Confidence level: 99%
- Margin of error: 3%
900 responses
- Confidence level: 95%
- Margin of error: 3%
500 responses
- Confidence level: 95%
- Margin of error: 4%
The larger the sample size, the more confident you can be in your findings. But for fast decision-making, a smaller sample size often works just as well—and it’s still much better than simply asking around the office (or working from a hunch!)
Larger sample sizes also allow you to drill further down into the data, offering a greater level of granularity and confidence in each demographic.
To put this into numbers:
- Directional (e.g. for brainstorming innovation ideas): 250-500 responses
- Statistically robust (e.g. for choosing innovation projects to prioritize): 501-2,000 responses
- Major, strategically important decisions (e.g. for major product launches): 2,001-4,000
Think about how question type affects sample size
When gathering quantitative data, you’ll generally want a large sample size for better accuracy.
If you’re gathering qualitative data, you’re probably looking for an overview of opinions within your target audience. But keep in mind that free text answers take more time to analyze—you’ll need to physically read the answers and bundle terms together to be processed.
Pro tip 💡
Sample size depends on two things—the audience and the type of research.
For brand tracking, we advise that the ideal sample size is 1,000, but 500 will still be robust. For creative testing, other studies, or for very niche audiences, sample size can be smaller.
Increase sample sizes for published data
Data for internal decision-making purposes varies from that which will be used and distributed more widely (for instance, to the press).
Pro tip 💡
We recommend using a minimum sample size of 2,000 if you’re publishing the data externally.
How to create surveys for international audiences
Here are some key points to think about when creating your multi-market survey.
Using one language is fine—if you do it properly!
You might want to send surveys to multiple countries, but say, for example, those countries are the USA, Canada, the UK and Australia. In that case, you could replicate the same English version of the survey and send it to all 4 markets in one go (something you can actually do with Attest!).
If you do this, remember to bear subtle cultural and language differences in mind. For example, if you’re asking about chips, Americans think of those as one thing, while Brits know them as something different. You can allow for this when you write your survey by being as descriptive and inclusive as possible.
Get your surveys translated where appropriate
This should go without saying, but we’ll say it anyway.
Make the time, effort and investment to get your surveys translated into high-quality versions that can be sent to your respondents in their primary language.
Pro tip 💡
Stay away from low quality translations from things like Google Translate (for your surveys at least)!
While Google’s tool is perfect when you’re trying to remember the French word for donkey, it’s definitely not ideal for getting fully contextualized, nuanced and complex translations of your surveys.
Remember to build translation time into your project plan—it’s a vital step that you can’t afford to skip, but you’ll need to allow time for your translation to be written to a high quality. For this, we recommend reviewing the MRS-ATC Translation Checklist for advice on finding a specialist translation agency that is ISO 17100-registered.
Here’s a great example of a translated question from a survey sent to consumers in Portugal…
Check your demographics
In an ideal world, population demographics would be consistent from market to market.
This isn’t an ideal world, however.
You should make sure you understand what each market’s demographic criteria are. For example, nationally representative samples—or Nat Rep—often include different ages and population makeups from country to country.
Make sure you know this when digging into your data—you don’t want to draw conclusions from your insights that you then need to revisit because you’ve been looking at the wrong groups of consumers.
Consider local demographic nuances and legalities
Some countries have laws and customs that mean you can’t or shouldn’t ask certain demographic qualifying questions.
For example, you cannot legally ask about race or ethnicity in Germany and France (unless for specific reasons).
When asking about gender and sex in the UK or US, you are expected* to include options other than ‘Male’ or ‘Female’. In Saudi Arabia or Russia, where it is illegal or de facto illegal to be LGBTQ+, you should not include other options.
*This is in the MRS Code of Conduct and Best Practice Guide.
Other demographic factors to think about are:
- Salary bands: This will not be as simple as using a currency converter because of each country’s economic status. For example, salary bands in the US are significantly higher than in Thailand, where the cost of living is much cheaper.
- Occupation: There may be country-specific jobs or role definitions.
- Political affiliation: This will not be as simple as saying ‘left-leaning’ or ‘right-leaning’, as even left and right, or liberal and conservative, are relative to each country. For example, Germany and France have a political landscape that is more socialist than the US, so their ‘conversative’ may be considerably different to the US definition of conservative. And in the UK, ‘conservative’ might be confused with the actual Conservative Party—while there’s an ideological link between the two, they do still have slightly different meanings.
Localize your questions wherever possible
Although your translation agency should do this for you, it’s good to be aware of how certain questions may affect your benchmarking.
For example, if you are asking a question about consumer goods or stores to people from multiple countries, the brand names will need to be reviewed for their relevance in that country.
Fun fact: ‘KFC’ in the US is known as ‘PFK’ in Quebec.
And some brands may not be available in other countries, such as high-end supermarket ‘Waitrose’ in the UK. In this case, you would need to find a price point equivalent in the other country.
Fun fact: for France, the match for ‘Waitrose’ would be high-end supermarket ‘Monoprix’.
Use open text questions with caution
While great survey questions that ask for open text answers are really valuable in most cases, having to analyze open text responses that have been submitted in multiple languages can be difficult.
It’s likely to extend the time it takes to review your research results if you take a DIY approach, or—more likely—if you need to outsource that analysis.
Double-check your image choices
Think about the media you use when creating your survey. Could this be completely unrelatable—or worse, offensive—to your participants?
For example, an innocent image of friends sharing a beer in a park would not be suitable for cultures that do not allow alcohol.
Keep a master English version
Having a master version of the survey that you can refer back to when you’re analyzing your insights makes things a whole lot easier.
Comply with regional regulations
This bit’s not fun, but it is super important.
Bear local data protection laws in mind when creating your research—for example GDPR in Europe, the California Consumer Privacy Act in California, US, and the PIPL in China.
And make sure you remain compliant with ISO 27001 / ISO 20252 if you are certified – when writing and translating your survey, as well as processing the responses.
If you’re unsure about any of the nuances you need to think about for your international research, here’s a list of research and insights associations who’ll be able to guide you through the nitty gritty of your particular region’s research.
And of course you can run seamless international research – and easily compare each market side-by-side – with Attest.
How to analyze your survey results
Congratulations—your survey results are in!
You’ve reached a major milestone in your research project. But the fun’s not over just yet.
Next up, you need to dig into your data to find those all-important insights that you’ll take back to your colleagues.
Here are some essential steps to take when you’re ready to dive into your data.
Search for demographics that over- or under-index
If your research covers a broad audience, you’ll be able to search for outlying demographic groups.
With a wider population to compare each demographic to, you can toggle filters on and off to figure out which demographic groups vary the most from the overall results (or at least if the insights buck stereotypes or expectations).
Keep an eye out for results where demographics over- or under-index from the average. It’s these points that add color to your understanding of consumers, bringing them to life as people with real opinions that vary from the norm.
You can use this information in loads of different ways, but what it will reveal is the most interesting opportunities for you to explore—perhaps in relation to a certain demographic.
You might also figure out that you need to do some extra research to get an even clearer picture of your target market. If that’s the case you could use some of these demographic survey questions to dig a bit deeper.
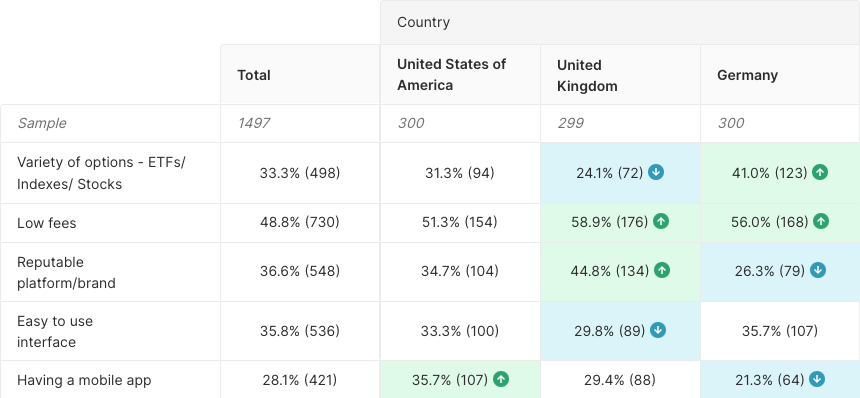
Crosstab for rich[er] insights
Another way to spot points of interest is by using ‘crosstabs’.
If consumer attitudes or behaviors aren’t divided cleanly by their demographic segments then there might be insights lurking in the answers respondents give.
For this, you’ll need to review your insights at the question level, rather than the demographic level. Without meaning to blow our own trumpet, we actually built this feature into our platform. When you click a specific answer option, you’ll be able to see how people who chose that option (and therefore think or behave in a certain way) answered the rest of the survey.
Here’s an example of a crosstab—AKA results breakdown—on the Attest dashboard…
Compare over time
Because consumer attitudes and behaviors shift continually, it’s rare that a single survey will give you an accurate long-term view.
Consider ‘trackers’—replica surveys that are run at regular intervals. This generates data over a period of time, and allows you to witness fluctuations on consumer sentiment and behavior over time.
Use ‘line charts’ to track these fluctuations over time to create a clear sense of trends, or the ‘direction of travel’ of certain insights. You and colleagues can effectively see the way the market is moving (and plan for the future to stay ahead of it).
Dig into what different audience segments say
When you’re looking through your data, it can be super helpful to be able to see side-by-side how different groups of respondents differ.
This is where segmentation comes in. This gives you a way to combine conditions, such as demographics or answers to certain questions, and compare those groups next to each other.
If you’re looking for more on how to dig into your survey results and how segments can give you a better understanding of important nuances in your audience groups, check out our webinar from our Product and Customer Research teams 👇
Follow up on anything surprising
No matter how much preparation you put into your research project, you can’t predict which insights will emerge.
If your research uncovers something really surprising, or leaves you with more questions than you started with—great! That means you’ve gathered some genuinely thought-provoking data that really challenges your hypothesis.
And it certainly doesn’t mean your initial research was pointless. The opposite is true! Often it’s the surprising learnings that end up being the most valuable. Scientists yearn for their work to open up more areas of exploration. So you’re basically a scientist at this point. Well done you.
Qualitative video responses
Using unmoderated qualitative video responses or interviews for your consumer research is like running focus groups—but faster, cheaper and more convenient.
You get honest, candid and comprehensive feedback from your target consumers, without having to get them all in the same room at the same time. And that’s before we get to the catering…
It’s still a super valuable way to run qualitative research—when it’s done well!
To make sure yours is done well, follow these essentials and watch your high-quality video responses come rolling in…
Here’s a snapshot of the tips:
- Add framing words to encourage better responses
- Keep questions focused on a single topic
- Break questions down into questions and talking points
- Don’t fret over the length of answers
- Choose a slightly bigger sample size
- Use screening questions to get the respondents you need
And if you’re looking for a little refresher on the difference between unmoderated and moderated research, check this out 👇
Unmoderated vs. moderated research
There are two main types of qualitative research: moderated and unmoderated.
What’s the difference?
There’s no researcher present when people submit unmoderated qualitative research responses. This allows the respondents to give their responses in their own time and in their own comfortable environment.
Moderated research is where a researcher ‘moderates’ the sessions. Having a researcher right there in the room where it happens allows them to probe further into specific topics, giving a deeper level of insights.
It’s good to know the pros and cons of each type of research, so that you can make sure you set up the right research for your needs—and you get genuinely useful results.
Unmoderated vs. moderated research
Here are the pros and cons of unmoderated and moderated qualitative research.
Pros and cons of unmoderated qualitative research
- Bias-free environment: For unmoderated research, respondents record their own answers, eliminating any risk of bias from someone else like a moderator or another participant being in the room. Respondents don’t then feel the need to say what they think the moderator might want to hear, or alter their future responses based on reactions they received in the room, giving you more truthful responses.
- Candid responses: People often feel more able to speak their mind when they’re in a safe, comfortable environment. This helps give you more reliable feedback and insights you can really trust.
- Time and cost effective: It’s cheaper, easier and quicker to set up and gather unmoderated qualitative research. This is because you don’t need to gather people in the same place to conduct the research.
- Easier to sort through responses: If people are asked to record separate video responses for each question, your research output is already sorted into easily digestible results, saving you time and effort.
Cons of unmoderated qualitative research
- Less control over the responses: Because you’re not in the same room as your respondents, you can’t help people through the questions as easily. And you can’t follow up with ah hoc questions based on their responses.
- Bigger sample size: By not being in the room with respondents, you can’t help them through the survey in the same way. This will result in some responses being slightly lower quality. To make sure you get enough useful responses, you’ll probably need to have a slightly higher sample size than you would for a fully moderated research session.
Pros of moderated qualitative research
- Control over research’s direction: If a researcher is in the room they can ask ad hoc questions in response to topics and points raised in the discussion. This can help gather more in-depth responses.
- Responding to body language: It’s also possible to react to respondents’ body language when you’re in the room with them. You can then adjust your approach if any respondents seem to be shy or distracted.
Cons of moderated qualitative research
- Expensive and time-consuming: Getting researchers and respondents in the same room at the same time will take longer to organize, and will likely result in a higher cost for the research. And you can’t always guarantee that respondents will even turn up!
- Bias is more likely: People are likely to behave differently around people than they would in the comfort of their own environment. This can mean that they tailor their responses to please the moderator, or based on what other participants might say. And this will give you unreliable results.
- Harder to sort through output: Even if you record your moderated research session, you’ll then need to sort through the recording and note down the responses to different questions and topics.
How to write questions for unmoderated research
You won’t be in the room with them to clarify any questions or point them in the right direction, so it’s worth taking the time to craft a beautiful survey.
If you’re not clear with instructions and questions, you might get responses that aren’t useful or valuable to your business.
Here are some tips on how you can make sure your research gets responses you can actually use!
Add framing words to encourage better responses
You want respondents to give you detailed answers that get to the heart of your topic. Encouraging respondents to add detail to their answers sets their expectations from the outset on how they should approach the question.
Don’t worry if your questions end up sounding repetitive as a result—it’s the most helpful way to guide respondents and that should be your priority.
Here are some examples of how you could add framing to questions:
- Can you describe in detail how you…
- Can you explain your answer by giving examples of…
It can be useful to ask people to describe their answer as a story. Using an occasion—e.g. ‘…the first time you…’, ‘tell us about when you last used…’—will help your respondents reflect more deeply on the questions.
Keep questions focused on a single topic
This goes for all survey questions—limit yourself to one topic per question. Adding additional topics will confuse respondents. They won’t know which aspect to focus on and you’ll get unfocused, unhelpful responses.
It’ll also make your analysis a whole lot easier if you focus on one topic per question!
For the same reason, you should keep like and dislike questions separate (e.g. don’t ask: What do you like and dislike about…?).
Break questions down into questions and talking points
You want to add structure and clarity to your questions, helping respondents fully understand what you want them to think about. A good way to do this is to break them down to questions and talking points/prompts.
We’ve found that without a structure like this, the natural response for a lot of people is to give shorter answers that don’t really cover what you need.
Your talking points or prompts shouldn’t be a way for you to ask extra mini questions on different topics. You should use them to help respondents tell you a focused story in their response.
Here’s an example:
| Example | Why? | |
| Question | “The cost of living crisis is impacting the way that many people are spending. We’d like to hear more about how this is impacting you and others around you.” | The most general question you could ask Introduces the context Sets expectations |
| Talking points | “Some points we’d like to hear from you about—please speak about these in detail: – What are your concerns about the cost of living in the coming months? – How has it impacted your decision to spend? – In which areas of your life have you been most affected?” | Subdivides the central question into more specific topical questions Limits the overall scope of topics to a manageable amount Doesn’t conflate too many topics into one question |
Don’t fret over the length of answers
Unlike more traditional qualitative methods such as in-person focus groups, or interviews, you will get a level of variation in the depth and engagement of responses.
Not everyone has done qualitative research before, but that can also mean that you get much better representation of your true target consumer as they are less self-selecting.
Some respondents will be incredibly verbose – and that’s great! They might help you get the depth on themes you’re really interested in.
Other responses will be shorter—3 or 4 sentences perhaps—but these are often great sound bites as they can be super articulate around the subject itself. This type of response can be great in helping you understanding the prevalence of certain themes.
Choose a slightly bigger sample size
Regardless of how beautifully you set up your survey, it’s unlikely that all of your respondents will record video responses that are exactly the insight you’re looking for.
By using a sample size that’s slightly bigger than the number of responses you want you should end up with a good amount of useful responses. But you also don’t want to gather too many responses, as that will add more time and effort to the analysis stage.
For unmoderated qualitative research like this we recommend a sample size of between 20 and 30.
Use screening questions to get the respondents you need
By running qualitative research like this, you’ll be going in-depth into quite specific topics. That means you’ll need your respondents to be the right people with the right level of knowledge and experience for your research.
Make sure that your screening questions are robust enough to only let through respondents who you know will have plenty to say on your topic.
This is an art, not a science. Although you want robust screeners, don’t make them so specific that you’ll struggle to get responses.
With qualitative studies like this, using a nationally representative sample might not be ideal because the small sample size won’t necessarily include enough people from your target demographics.
And if you’re able to set up demographic targeting (which you can with Attest!) you can use this to help you get the right respondents.